Foreclosure inventory fell in August to its lowest point in more than a decade, according to the latest Loan Performance Insights Report from CoreLogic.
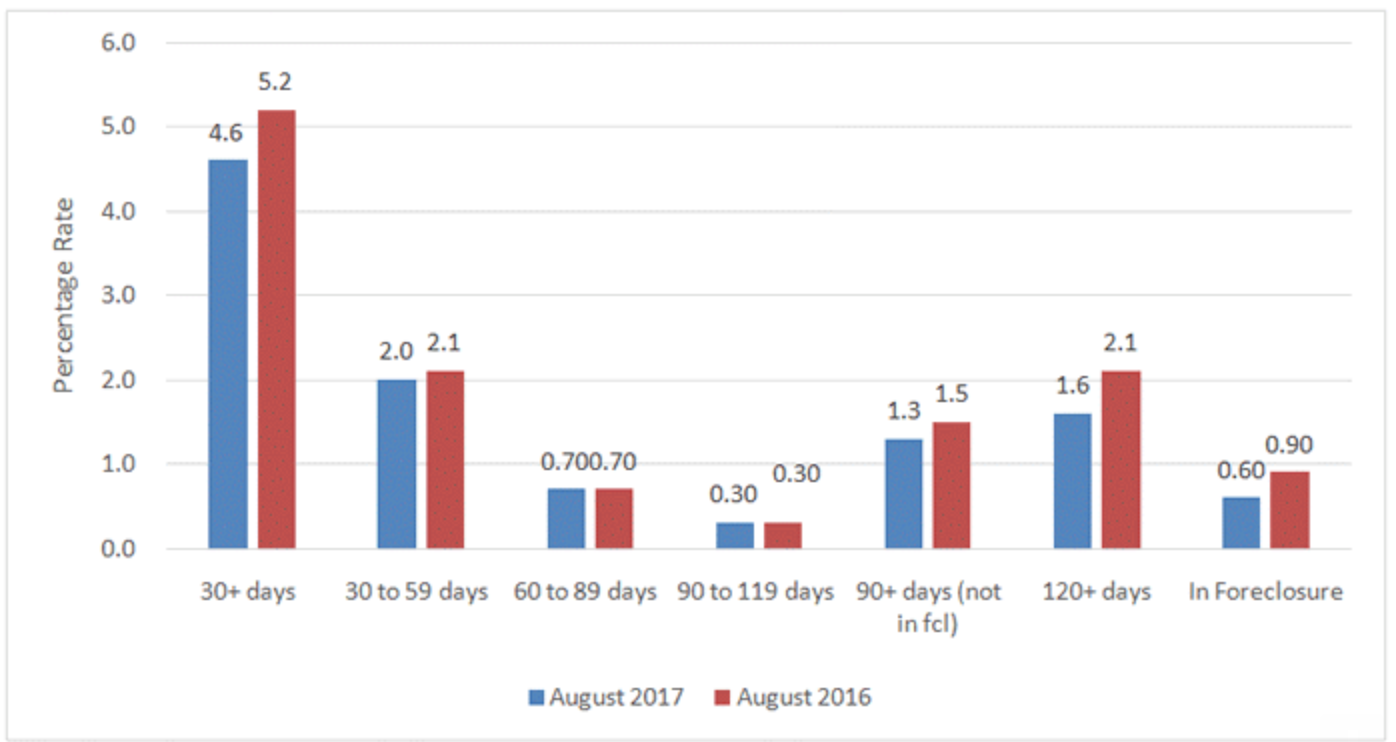
Nationally, 4.6% of mortgages remained in some stage of delinquency, 30 days or more past due including those in foreclosure. That is the same as July’s levels but down 0.6 percentage points from August 2016’s 5.2%.
As of August, the foreclosure inventory rate, which measures the share of mortgages in some stage of the foreclosure process, dropped to 0.6%. This is down from 0.9% in August 2016 and the lowest inventory rate for the month of August in 11 years, since August 2006 when it was 0.5%.
“The effect of the drop in crude oil prices since 2014 has taken a toll on mortgage loan performance in some markets,” CoreLogic Chief Economist Frank Nothaft said. “Crude oil prices this August were less than half their level three years ago. This has led to oil-related layoffs and an increase in loan delinquency rates in states like Alaska and in oil-centric metro areas like Houston.”
CoreLogic explained measuring early-stage delinquency rates is important for analyzing the health of the mortgage market. To monitor mortgage performance comprehensively, the company examines all stages of delinquency as well as transition rates, which indicate the percentage of mortgages moving from one stage of delinquency to the next.
The rate for early-stage delinquencies, defined as 30 to 59 days past due, was 2% in August 2017, down slightly from 2.1% in August 2016. The share of mortgages 60 to 89 days past due in August 2017 was 0.7%, unchanged from last year.
The serious delinquency rate decreased 0.5 percentage points from last year from 2.4% in August 2016 to 1.9% in August this year. This 1.9% level held steady in June, July and August, and marks the lowest level for any month since October 2007.
The chart below shows the mortgage delinquency rates in each stage of delinquency.
Click to Enlarge
(Source: CoreLogic)
“Serious delinquency and foreclosure rates are at their lowest levels in more than a decade, signaling the final stages of recovery in the U.S. housing market,” CoreLogic President and CEO Frank Martell said. “As the construction and mortgage industries move forward, there needs to be not only a ramp up in homebuilding, but also a focus on maintaining prudent underwriting practices to avoid repeating past mistakes.”
However, data from Black Knight shows that the hurricanes, which hit at the end of August and the beginning of September, caused mortgage delinquencies to surge in September by 214,000 or 9%.


