


Mortgage industry participants may disagree a great deal on several different topics. However, I expect that you would find no argument with the following statement: Mortgage lending is a highly competitive business.
While the scope of the market, which totaled roughly $4 trillion in volume each of the past two years, might suggest abundant opportunities, loan officers and companies need to stay on their toes to survive, let alone thrive in this environment.
Make no mistake: the mortgage market has become more competitive.
There are multiple different ways to measure the level of competition within an industry. First, simply look at the number of competitors. 2020 Home Mortgage Disclosure Act (HMDA) data showed that more than 4,300 lenders originated enough mortgages to meet the disclosure requirement, while many more lenders likely originated just a few loans that year.
These lenders included banks, credit unions, and independent mortgage banks (IMBs), all offering a similar product to millions of potential customers across the country through retail, wholesale, and consumer direct channels. Consumers can instantly compare mortgage products and rate offerings online either through lender websites directly or through the various websites that offer comparison shopping.
Some might argue that even though there are many potential competitors vying for a consumer’s loan, if there are certain competitors who dominate market share persistently over time, one could get a false perception regarding the intensity of competition.
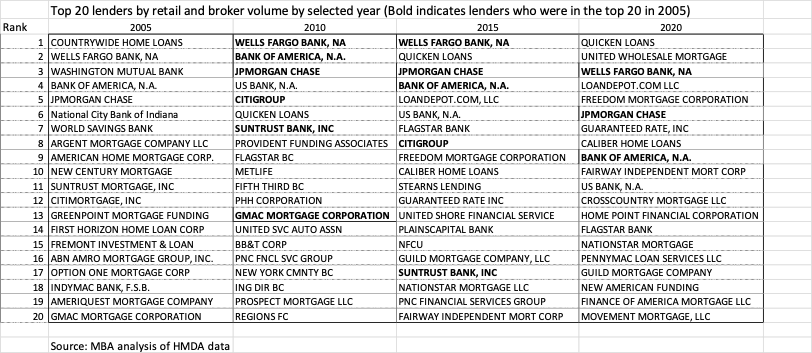
Are there lenders who have persistently dominated the mortgage market? Exhibit 1 shows lender rankings from MBA analysis of HMDA data over the past 20 years, in this case showing the top 20 lenders by retail and broker volume at four points over this time period. Lenders in bold were in the Top 20 in 2005 and in these successive years.
Clearly, the impact of the Great Financial Crisis (GFC) mattered, as there were a large number of failures and an extraordinary number of mergers and acquisitions among both banks and IMBs. Regardless, aside from the three largest banks in the country, it certainly looks difficult to remain at the top of the industry in terms of volume.
Exhibit 1: Top 20 Lenders Over Time
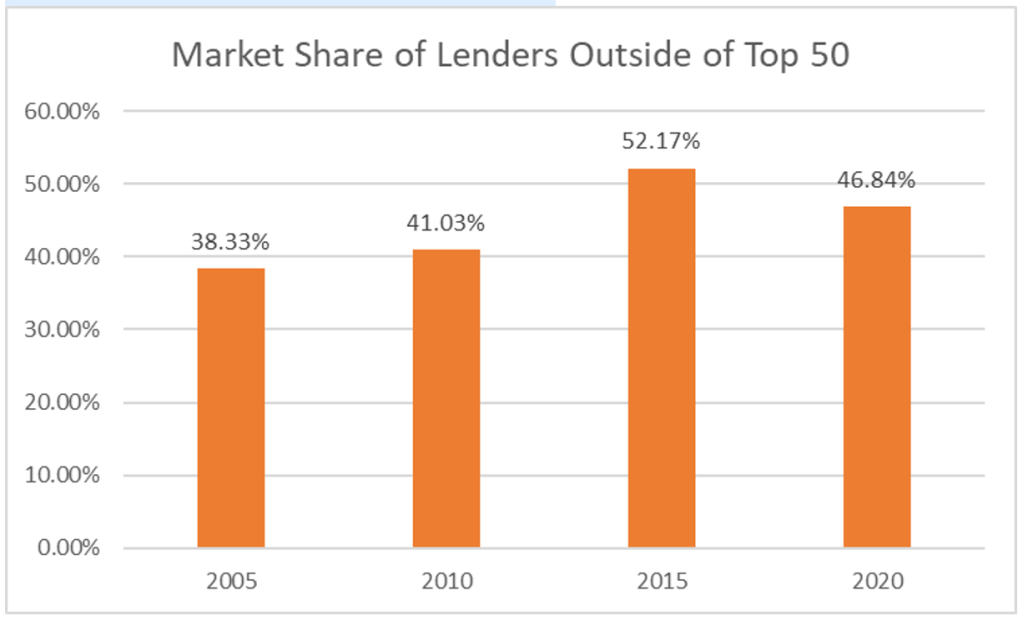
Perhaps more than simply looking at the leaderboard at different points in time, it’s interesting to see the proportion of industry volume accounted for by lenders outside of the top 50, per Exhibit 2.
These data suggest that the industry has gotten somewhat less concentrated over the last decade compared to the decade around the GFC. The fact that smaller lenders (outside of the top 50) as a group can originate half or more of total retail and broker volume highlights another important point. While it would be very difficult for a new entrant to immediately vault into the top 20, the prevalence of so many smaller lenders suggest there are plenty of choices for prospective borrowers.
Exhibit 2: Market Share of Smaller Lenders
Some published lender rankings include not only retail and broker volume, but also correspondent volume. For certain purposes, that is highly relevant. We know from industry benchmarking efforts that half or more of many larger lenders’ total volume can come from the correspondent channel.
However, competition policy is correctly focused on consumer welfare. Thus, measuring the level of competition in the mortgage industry should similarly focus on the competitors who interact with the consumer at the point of sale: retail loan officers and brokers.
Using correspondent volume would distort the fact that, underlying those correspondent volume numbers are hundreds or even thousands of smaller originators that touch the consumer — each lender making their own pricing and credit decisions and offering their own levels and quality of service to the borrower. Therefore, it makes sense to focus on retail and broker volume here.
Now, this casual analysis of the competitive landscape in the mortgage industry, in concert with their lived experience, may convince some. However, there are certainly more formal means of assessing the competitive structure of markets.
First, one could compute the summary measure of market concentration that the Department of Justice (DOJ) uses, the HHI. According to the DOJ’s website:
“The term “HHI” means the Herfindahl–Hirschman Index, a commonly accepted measure of market concentration. The HHI is calculated by squaring the market share of each firm competing in the market and then summing the resulting numbers. For example, for a market consisting of four firms with shares of 30, 30, 20, and 20 percent, the HHI is 2,600 (302 + 302 + 202 + 202 = 2,600).
The HHI takes into account the relative size distribution of the firms in a market. It approaches zero when a market is occupied by a large number of firms of relatively equal size and reaches its maximum of 10,000 points when a market is controlled by a single firm. The HHI increases both as the number of firms in the market decreases and as the disparity in size between those firms increases.
The agencies generally consider markets in which the HHI is between 1,500 and 2,500 points to be moderately concentrated, and consider markets in which the HHI is in excess of 2,500 points to be highly concentrated.”
Source: Justice.gov
As a comparison, consider the market for soft drinks in the United States. According to statista.com, in 2020, Coke had a market share of 44.9%, and Pepsi was at 25.9%, which indicates an HHI of 2,678 looking at just the top two companies. This matches the level that the DOJ suggests is “highly concentrated.”
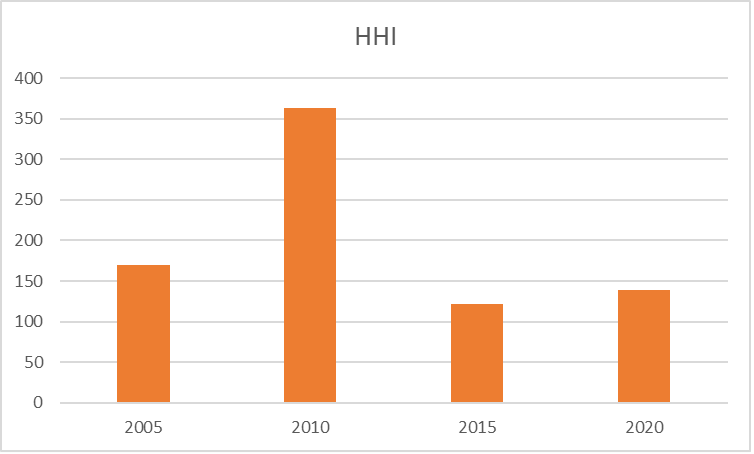
No lender in the mortgage industry has close to the level of market share claimed by Coke or Pepsi, so not surprisingly, the HHI for mortgage origination has been considerably lower in the past 20 years, peaking at about 350 in 2010, immediately following the financial crisis, and now at a level below 150. The mortgage industry’s level of concentration has been considerably below the levels that would raise policy concerns by DOJ.
Admittedly, this is a very high-level analysis. In actual regulatory investigations regarding the competitive nature of markets, defining the market is a critical step. Is the U.S. retail and broker market volume a single market? Or would it be more appropriate to examine concentration on a state or metro-level? No doubt, lender rankings vary considerably in different parts of the country. And the requirement for IMBs and state-chartered banks to be licensed and regulated in a state in order to offer loans adds to costs of expanding into new markets.
However, technology has likely made it easier to enter more markets more quickly over time. Looking at the national HHI statistics, the level of competition again appears to have increased — not decreased — over the past decade compared to the prior one. Technology has likely enabled more robust competition over more geographies than had been the case previously.
Exhibit 3: HHI for the Mortgage Industry
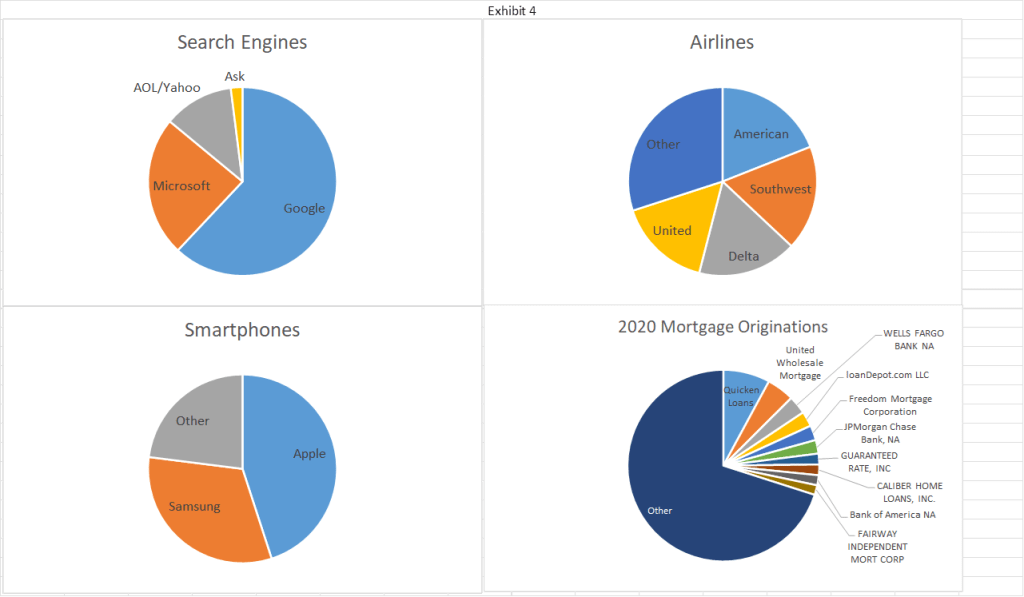
Just by way of comparison, Exhibit 4 compares the market shares of leading lenders in the mortgage industry to leading companies in other sectors of the economy. Clearly, concentration is much higher in several other sectors.
Exhibit 4: Competition in Mortgage vs. Other Sectors
Finally, in addition to examining the number of competitors, the persistence of market leaders, and more formal measures of market concentration such as the HHI, another factor to consider is whether incumbents/market leaders can sustain above market returns for extended periods, another indicator of excessive market power or concentration.
Exhibit 5 shows data from the PGR: MBA and Stratmor Peer Group Roundtable program for the past two decades. This chart shows the level of net production income in basis points by type and lender size.
Exhibit 5: Net Production Income (basis points) By Peer Group
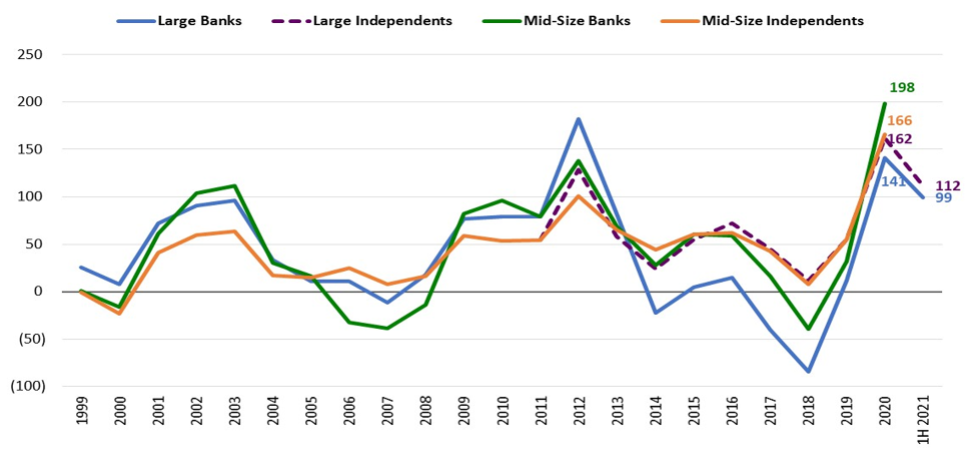
A few themes stand out. First, profitability in this industry is highly cyclical. Lenders tend to be more profitable in refinance waves, and less profitable during purchase markets, which also tend to be times of lower origination volume.
Second, while the magnitudes may differ, the trends in profitability tend to be similar for lenders of different sizes and business models. If anything, the cyclicality seems to be more pronounced for the larger lenders, who likely also have a larger fixed cost base.
Finally, note that banks report losses on their mortgage origination business during the lean times. IMBs don’t, not because they don’t lose money, but rather because IMBs are monoline companies that only offer mortgages — if they lose money consistently, they go out of business and stop reporting data. Banks may lose money in mortgage at times and make money in other business lines.
Looking at these data, in concert with the average from MBA’s Quarterly Performance Report, reveals that the average origination margin over time has been in the neighborhood of 50 basis points of origination volume. However, that average requires lenders willing to make much less than that during tough years, with the potential to make more during refinance waves. In short, the wide swings in profitability are the hallmark of a highly competitive market, not a concentrated oligopoly.
To end where I began, for mortgage market participants, the intense competition in the mortgage market is apparent. However, there is always benefit in diving a bit deeper into the data to examine how the competitive landscape has changed over time. In doing that, it appears that over the past 10 years, the mortgage market has become even more competitive compared to the period right before and right after the great financial crisis. This competition benefits mortgage borrowers who use their power to shop across lenders of different sizes and different business models.
This column does not necessarily reflect the opinion of HousingWire’s editorial department and its owners.
To contact the author of this story:
Mike Fratantoni at [email protected].
To contact the editor responsible for this story:
Sarah Wheeler at [email protected]


