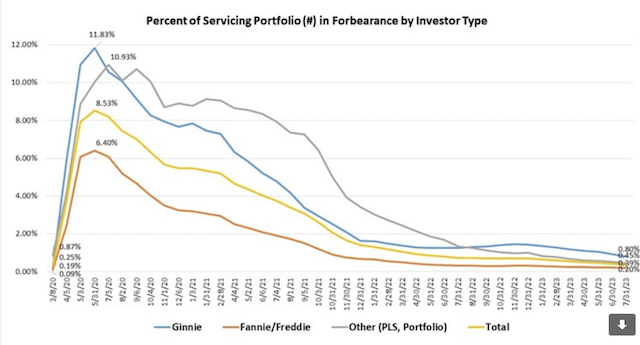
The total number of loans now in forbearance decreased by 5 basis points to 0.39% of servicers’ portfolio volume in July from 0.44% May, according to the Mortgage Bankers Association’s (MBA) monthly loan monitoring survey.
The MBA estimates about 195,000 homeowners are in forbearance plans. Mortgage servicers have provided forbearance to about 7.9 million borrowers since March 2020.
The prevalence of forbearance plans has dropped dramatically since 2020 and the reasons that borrowers are in forbearance are changing, the MBA said.
“About two-thirds (69.3%) of borrowers are still in forbearance because of the effects of COVID-19, but a growing share of borrowers are in forbearance for other reasons that cause temporary hardship such as financial distress (24.2%) or natural disasters (6.5%),” Marina Walsh, MBA’s vice president of industry analysis said.”
“With the COVID-19 national emergency lifted, Fannie Mae and Freddie Mac recently announced the retirement of certain COVID-19 flexibilities relating to forbearance plans and workouts. Given the recent natural disasters impacting California, Washington, and Hawaii, forbearance is one way for mortgage servicers to mitigate the potential impacts on homeowners,” Walsh added.

Sorted by investor type, the share of Ginnie Mae loans in forbearance decreased 13 bps to 0.80% in July and the forbearance share for portfolio loans and private-label securities (PLS) dropped 7 bps to 0.45%. The share of Fannie Mae and Freddie Mac loans in forbearance decreased 1 basis point to 0.20% during the same period.
By stage, 36.5% of total loans in forbearance are in the initial forbearance plan stage, while 53.3% are in a forbearance extension. The remaining 10.3% are forbearance re-entries, including re-entries with extensions.
Washington, Colorado, Idaho, Oregon and California were the five states with the highest share of loans that were current – not delinquent or in foreclosure – as a percent of servicing portfolio. Louisiana, Mississippi, Indiana, New York, and West Virginia had the lowest share.
Total loans serviced that were current as a percent of servicing portfolio volume decreased to 96.02% in July from June.


