Home prices continued to cool at the start of the year, falling to a 3.8% annual price growth rate in January, according to the S&P CoreLogic Case-Shiller National Home Price Index, released Tuesday. The annual growth rate in December was 4.4%.
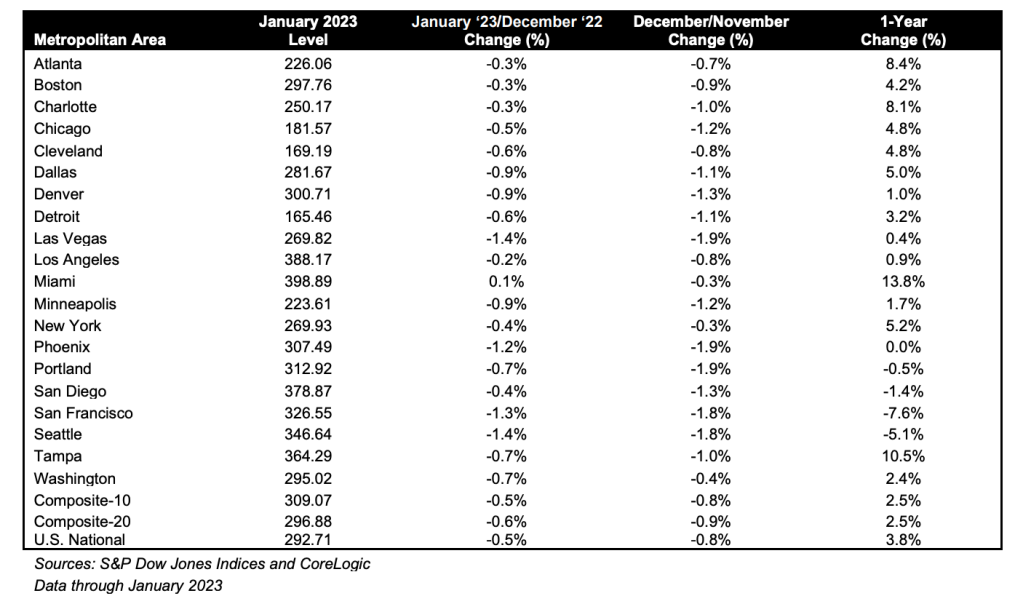
The index came in at a reading of 292.71 in January. On a month-over-month basis, the U.S. National Index was down 0.5% in January before seasonal adjustment.
“2023 began as 2022 had ended, with U.S. home prices falling for the seventh consecutive month,” Craig Lazzara, the managing director at S&P DJI, said in a statement.
The national composite index now stands 5.1% below its peak in June 2022. The S&P CoreLogic Case-Shiller 20-city composite home price Index is a value-weighted average of the 20 metro area indices. The indices have a base value of 100 in January 2000; in other words, a current index value of 150 translates to a 50% appreciation rate since January 2000 for a typical home located within a particular market.

With the Federal Reserve choosing to boost interest rates yet again last, week forecasters predict home prices to continue at fall mildly over the next few months.
“Financial news this month has been dominated by ructions in the commercial banking industry, as some institutions’ risk management functions proved unequal to the rising level of interest rate,” Lazzara said in a statement. “Despite this, the Federal Reserve remains focused on its inflation-reduction targets, which suggest that rates may remain elevated in the near-term. Mortgage financing and the prospect of economic weakness are therefore likely to remain a headwind for housing prices for at least the next several.”
Persistent challenges related to low inventory, however, will prevent home prices from falling dramatically.
“There are two major reasons to explain why home prices are remaining firmer than some might have expected. First, despite the fact that inventory has increased from a year ago, supply is still very low by historical standards. Buyers in the market still find themselves competing over relatively few homes for sale, a fact which continues to prop up home prices,” Lisa Sturtevant, the chief economist at BrightMLS, said in a statement. “Second, while rising home prices and higher mortgage rates have priced many buyers out of the market, other prospective buyers are still feeling upbeat about their financial situations and have been resolute in their decision to buy a home. Repeat buyers—buyers who are selling one home to buyer another—are able to bring record levels of housing equity to their home purchase, which has partially offset the impact of higher rates.”
The Case-Shiller home price indices for December is a three-month average of closing prices in, November, December and January. Because most home sales take several months from contract to closing, the data likely includes some deals struck in September and October.
Home price growth in the 10-city composite index also slowed in January, recording an annual gain of 2.5% to a reading of 309.07. In December, the 10-city index posted a yearly increase of 4.4%. Compared to a month prior, the 10-city index was down 0.5% before seasonal adjustment in January.
The 20-city home price index posted a 2.5% annual increase, down from 4.6% in December, bringing it to a reading of 296.88. Month over month, the 20-city index dropped 0.6% before seasonal adjustment.
Yet again, Miami (13.8%), Tampa (10.5%) and Atlanta (8.4%) reported the highest yearly price gains among the 20 cities analyzed. Despite posting he largest year-over-year increases among the 20 cities analyzed, Miami, Tampa and Atlanta, posted lower price increases for the year ending January 2023 versus the 12 months ending December 2022, as did the other 17 cities in the analysis.
Prior to seasonal adjustment, 19 of the 20 cities reported monthly declines with only Miami an increase at 0.1%.
“Miami (+13.8% year-over-year) was the best performing city in January, extending its winning streak to six consecutive months,” Lazzara said in a statement. “At the other end of the scale, one of the most interesting aspects of January’s report is the continued weakness in home prices on the West Coast, as San Diego and Portland joined San Francisco and Seattle in negative year-over-year territory. It’s therefore unsurprising that the Southeast (+10.2%) continues as the country’s strongest region, while the West (-1.5%) continues as the weakest.”
Correction: An earlier version of this story reported that the 10-city composite index in January 2023 was 109.07; it is 309.07.


