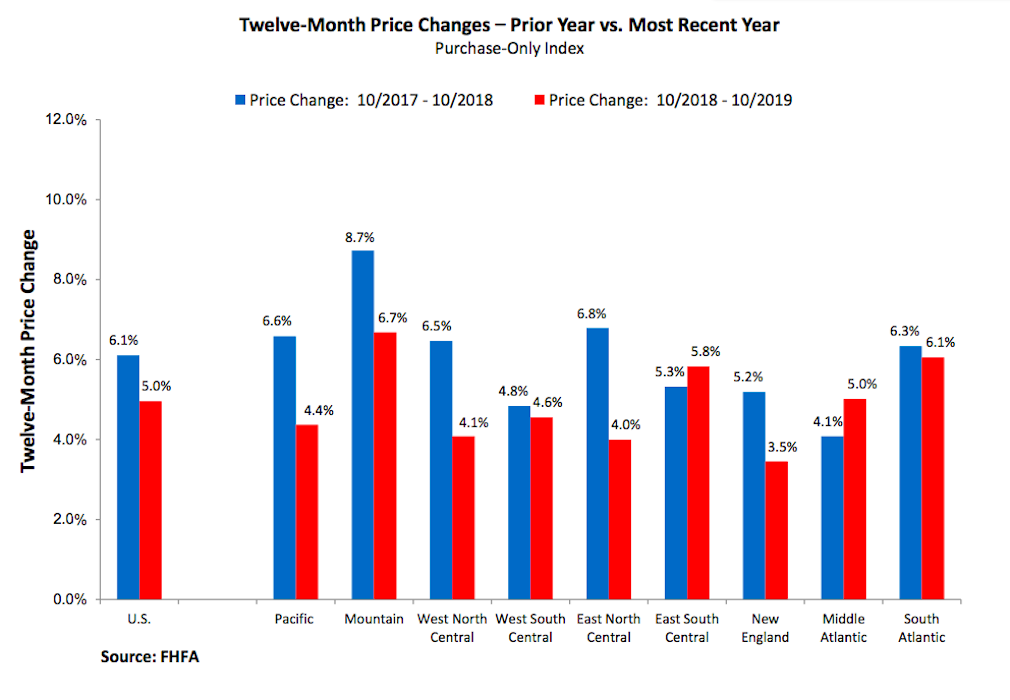
Home prices increased in October, rising only 0.2% from the previous month but up 5% from 2018, according to the latest monthly House Price Index from the Federal Housing Finance Agency.
The FHFA monthly HPI is calculated using home sales price information from mortgages sold to or guaranteed by, Fannie Mae and Freddie Mac. Because of this, the selection excludes high-end homes bought with jumbo loans or cash sales.
The report explains across the nine census divisions, the West South Central and East South-Central divisions saw the strongest appreciation growth, as both rose by 0.7% in October. The East North-Central division, which experienced no growth, saw appreciation decline by 0.5%.
According to the FHFA, the 12-month changes were all positive, with the New England division posting the smallest gain of 3.5%, and the Mountain division leading the way with a 6.7% increase.
These are the states located in each division mentioned:
West North Central: North Dakota, South Dakota, Minnesota, Nebraska, Iowa, Kansas, Missouri
East South-Central: Kentucky, Tennessee, Mississippi, Alabama
East North Central: Michigan, Wisconsin, Illinois, Indiana, Ohio
New England division: Maine, New Hampshire, Vermont, Massachusetts, Rhode Island, Connecticut
Mountain: Montana, Idaho, Wyoming, Nevada, Utah, Colorado, Arizona, New Mexico
The chart below compares 12-month price changes to the prior year:


