Although the nation’s employment rate has risen to new highs within the last couple of years, wages haven’t kept pace with home-price growth, leaving many homeowners struggling to afford housing.
So, how are these Americans making ends meet? LendingTree’s latest analysis revealed that there is a direct correlation between the rising cost of living and the increasing number of workers per household.
“As the cost of living rises, people are finding new ways to help make ends meet. For families, this could mean that both parents have to work jobs outside of the home,” LendingTree writes. “For single people, it could mean cohabitating with a roommate or a parent well into adulthood. Regardless of what it looks like for a specific household, the growing cost of living means that there are more workers per household than there have been over the past few decades.”
In order to determine this, the company focused on the one factor that contributes to the rise in the average number of workers per household – home price.
LendingTree’s analysis utilized data from the 2017 American Community Survey which details information regarding the total and average number of workers per household, as well as data on median home value.
According to LendingTree, its research confirms that there is a statistically significant relationship between a housing market’s median home price and the average number of workers per household in that metro.
“There is a positive correlation between the average number of workers per household and the median home price in the nation’s largest metros,” LendingTree writes. “With a statistically significant correlation coefficient of 0.56, our data shows that, barring a few exceptions, metropolitan areas where there are more workers per household are likely to have higher home prices.”
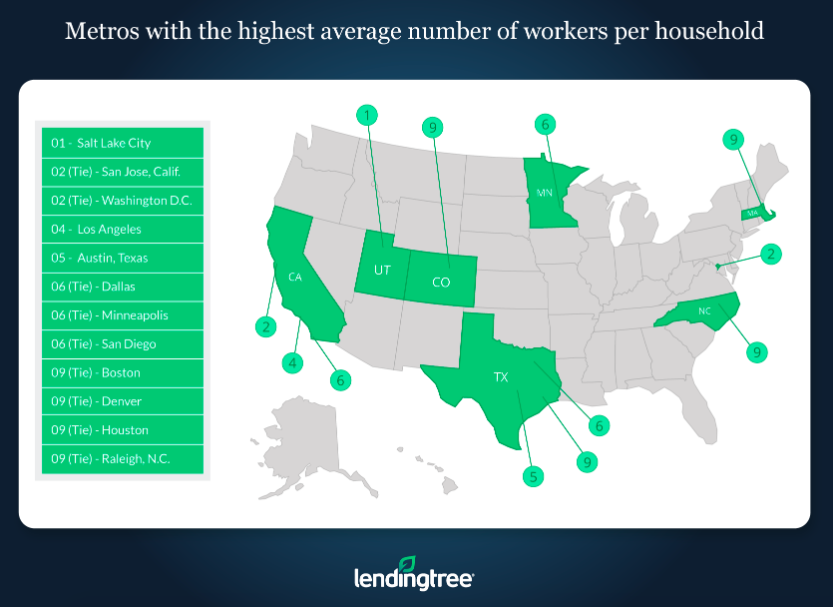
Out of every housing market in the nation, LendingTree discovered that Salt Lake City had the highest average number of workers per household. In this city, 11% of homes belong to homeowners with at least three or more individuals within the household employed.
“This is surprising because, although the median home price in that area is above average, it isn’t nearly as high as it is in other metros,” LendingTree writes. “As a result, there are probably other factors outside of home price, like marriage rates, that drive up the average number of workers per household in Salt Lake City. Nonetheless, our data indicates that marriage rates have less of an impact on the number of workers per household than home prices do.”
On the other end of the spectrum, LendingTree indicates that Pittsburgh’s metropolitan area has the lowest average number of workers per household. The company attributes the market’s low median home price as one of the main reasons why many households manage to get by with just a single worker.
Overall, the company determined that although the average number of workers per household is rising, the majority of households in America’s largest housing markets are still occupied by one or fewer workers.
“About 40% of households in the nation’s largest metros have only a single worker, which suggests that there is still plenty of opportunities for a single person to make enough income to keep their household afloat,” LendingTree writes. “Around 24% of households in the nation’s largest metros have zero workers, but that does not mean that those who occupy zero worker households have never worked, as some of these kinds of occupants are retired.”
The image below highlights the markets with the highest average number of workers per household:

NOTE: LendingTree utilized home value and employment data from the 2017 American Community Survey. For the purposes of this study, correlation coefficients above 0.5 were considered statistically significant, while coefficients between 0.49 and 0.11 were considered potentially significant and coefficients 0.1 and below were considered not significant, according to the company.


