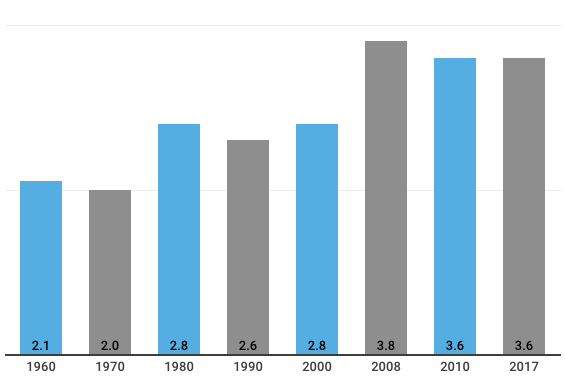
A good real estate agent might tell you that the general rule of thumb when buying a home is to follow a price-to-income ratio of 2.6, meaning that if you can afford the price of the home on 2.6 years’ worth of household income, it can be considered affordable.
But for homebuyers in most parts of the country, that 2.6 threshold is far out of reach, according to a recent study by Clever Real Estate.
 According to Clever’s research, price-to-income ratios have shot up since the 1960s, surpassing the 2.6 mark in the ’90s and nestling around 3.6 for the last couple of years. (See the chart from Clever to the left illustrating how the price-to-income ratio has changed over decades.)
This puts real estate in most markets well out of reach for the average earner.
Median home prices have risen in recent years, growing at four times the rate of household incomes since 1960, Clever reveals, adding that while median home prices increased 121% nationwide since that time, median household incomes rose only 29%.
Renters have been hit hard too. Median gross rent has increased 72% since the ’60s, surpassing adjusted incomes two-fold, Clever points out.
“Rising rents and increasing home prices make it harder than ever to save for a down payment and afford monthly mortgage payments,” the report notes.
While great geographic differences exist, there are only 16 markets out of the nation’s 100 most populated cities where the average earner can afford a house below the 2.6 sweet spot.
And, while it’s no surprise that the disparity between incomes and home prices is greatest in the West, it might be news that the Midwest is exceedingly affordable, with almost no gap between rent and income growth, meaning that renters have the opportunity to save for a down payment to afford a median mortgage in the region.
Below is a chart from Clever revealing the most and least affordable cities based on price-to-income ratios:


