In February, annual home price gains slowed across the country, according to the latest Case-Shiller Home Price Index from S&P Down Jones Indices and CoreLogic.
The report's results showed that February 2019 saw an annual increase of 4% for home prices nationwide, falling from the previous month's report.
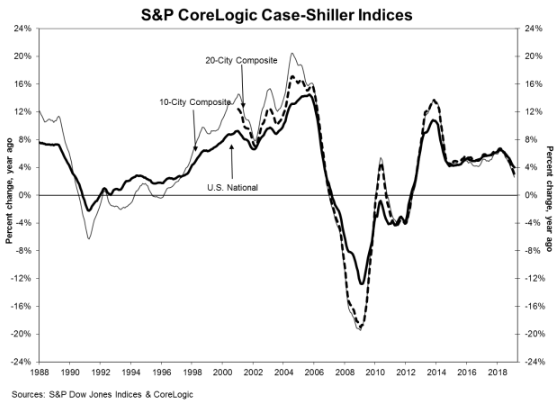
The graph below highlights the average home prices within the 10-City and 20-City Composites.
(Click to enlarge)
Before seasonal adjustment, the National Index decreased 0.2% month over month in February. The 10-City Composite and the 20-City Composite both posted a 0.2% month over month decrease.
After seasonal adjustment, the National Index recorded a month-over-month gain of 0.3% in February. Additionally, the 10-City Composite and the 20-City Composite posted also posted a 0.2% month-over-month increase.
The 10-City and 20-City composites reported a 2.6% and 3.1% year-over-year increase for the month, respectively. Before seasonal adjustment, 14 of 20 cities reported increases, while 17 of 20 cities reported increases after the seasonal adjustment.
S&P Dow Jones Indices Managing Director and Chairman of the Index Committee David Blitzer said the pace of increases for home prices continues to slow.
“Homes began their climb in 2012 and accelerated until late 2013 when annual increases reached double digits,” Blitzer said. “Subsequently, increases slowed until now when the National Index is up 4% in the last 12 months.”
And although sales of existing single-family homes have recovered since 2010 and reached their peak one year ago in February 2018, home sales have drifted down over the last year except for a one-month pop in February 2019, according to Blitzer.
“Sales of new homes, housing starts, and residential investment had similar weak trajectories over the last year,” Blitzer said. “Mortgage rates are down one-half to three-quarters of a percentage point since late 2018.”
Additionally, Blitzer notes that regional housing trends are changing, especially as previously thriving housing markets continue to lose appreciation.
According to the report, Las Vegas, Phoenix and Tampa reported the highest year-over-year gains among all of the 20 cities.
In February, Las Vegas led with a 9.7% year-over-year price increase, followed by Phoenix with a 6.7% increase and Tampa with a 5.4% increase. Notably, only one of the 20 cities reported larger price increases in the year ending February 2019 versus the year ending January 2019.
“The largest year-over-year price increase is 9.7% in Las Vegas; last year, the largest gain was 12.7% in Seattle. Regional patterns are shifting. The three California cities of Los Angeles, San Francisco and San Diego have the three slowest price increases over the last year. Chicago, New York and Cleveland saw only slightly larger prices increases than California,” Blitzer said. “Prices generally rose faster in inland cities than on either the coasts or the Great Lakes. Aside from Las Vegas, Phoenix, and Tampa, which saw the fastest gains, Atlanta, Denver, and Minneapolis all saw prices rise more than 4% — twice the rate of inflation.”


