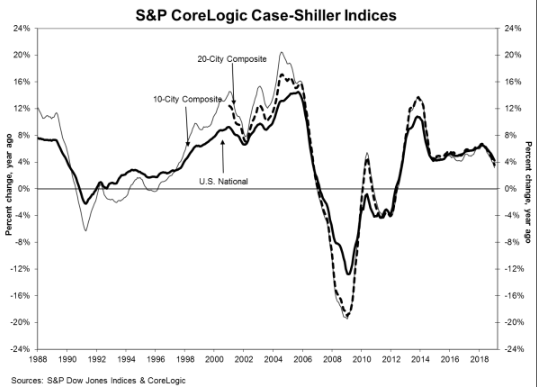
In January, annual home price gains slid nationwide, according to the latest Case-Shiller Home Price Index from S&P Dow Jones Indices and CoreLogic.
The report's results showed that January 2019 saw an annual increase of 4.3% for home prices nationwide, inching backwards from the previous month's report.
The graph below highlights the average home prices within the 10-City and 20-City Composites.
(Click to enlarge)
Before seasonal adjustment, the National Index decreased 0.2% month over month in January. The 10-City Composite and the 20-City Composite posted a 0.3% and 0.2% month over month decrease.
After seasonal adjustment, the National Index recorded a month-over-month gain of 0.2% in January. Notably, the 10-City Composite did not post any gains; however, the 20-City Composite posted a 0.1% month-over-month increase.
The 10-City and 20-City composites reported a 3.2% and 3.6% year-over-year increase for the month, respectively. Before seasonal adjustment, five of 20 cities reported increases, while 14 of 20 cities reported increases after the seasonal adjustment.
According to the report, Las Vegas, Phoenix and Minneapolis reported the highest year-over-year gains among all of the 20 cities.
In January, Las Vegas led with a 10.5% year-over-year price increase, followed by Phoenix with a 7.5% increase and Minneapolis with a 5.1% increase. Notably, only one of the 20 cities reported larger price increases in the year ending January 2019 versus the year ending December 2018.
S&P Dow Jones Indices Managing Director and Chairman of the Index Committee David Blitzer said home price gains continue to shrink.
“In the year to January, the S&P CoreLogic Case-Shiller National Index rose 4.3%, two percentage points slower than its pace in January 2018,” Blitzer said. “The last time it advanced this slowly was April 2015. In 16 of the 20 cities tracked, price gains were smaller in January 2019 than in January 2018. Only Phoenix saw any appreciable acceleration.”
In fact, some cities where prices surged in 2017-2018 now face much smaller increases. An example is Seattle, where annual price gains dropped from 12.8% to 4.1% from January 2018 to January 2019. Furthermore, San Francisco saw annual price increases shrink from 10.2% to 1.8% over the same time period, according to Blitzer.
That being said, Blitzer notes that mortgage rates are just as important as prices for many home buyers.
“Mortgage rates climbed from 3.95% in January 2018 to a peak of 4.95% in November 2018. Since then, rates have dropped to 4.28% as of mid-March,” Blitzer continued. “Sales of existing single-family homes slid gently downward from the 2017 fourth quarter until January of this year before jumping higher in February 2019. Home sales annual rate dropped from 5 million units in February 2018 to 4.36 million units in January 2019 before popping to 4.94 in February.”
Despite these sliding rates, Blitzer said it remains to be seen if recent low mortgage rates and smaller price gains can sustain improved home sales.


