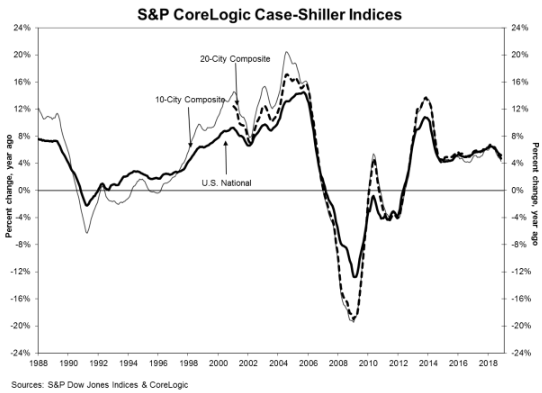
In November, annual home price gains slowed nationwide, according to the latest Case-Shiller Home Price Index from S&P Dow Jones Indices and CoreLogic.
The report's results showed that November 2018 saw an annual increase of 5.2% for home prices nationwide, falling from the previous month's report.
The graph below highlights the average home prices within the 10-City and 20-City Composites.
(Click to enlarge)

Before seasonal adjustment, the National Index increased 0.1% month over month in November. The 10-City Composite came in at 4.3%, falling from 4.7% the month before. Furthermore, the 20-City Composite posted a 4.7% year-over-year gain, sliding from 5% in October.
After seasonal adjustment, the National Index recorded a month-over-month gain of 0.4% in November. Notably, the 10-City Composite and the 20-City Composite both posted 0.3% month-over-month increases.
The 10-City and 20-City composites both reported a 0.1% decrease for the month. Before seasonal adjustment, eight of 20 cities reported increases, while 15 of 20 cities reported increases after the seasonal adjustment.
According to the report, Las Vegas, Phoenix and Seattle reported the highest year-over-year gains among all of the 20 cities.
In November, Las Vegas led with a 12% year-over-year price increase, followed by Phoenix with an 8.1% increase and Seattle with a 6.3% increase. Notably, Seven of the 20 cities reported larger price increases in the year ending November 2018 versus the year ending October 2018.
S&P Dow Jones Indices Managing Director and Chairman of the Index Committee David Blitzer said home prices are still rising, but more slowly than in recent months.
“The pace of price increases are being dampened by declining sales of existing homes and weaker affordability,” Blitzer continued. “Sales peaked in November 2017 and drifted down through 2018. Affordability reflects higher prices and increased mortgage rates through much of last year. Following a shift in Fed policy in December, mortgage rates backed off to about 4.45% from 4.95%.”
Blitzer also said housing market conditions are mixed while analysts’ comments express concerns that housing is weakening and could affect the broader economy.
“Current low inventories of homes for sale – about a four-month supply – are supporting home prices. New home construction trends, like sales of existing homes, peaked in late 2017 and are flat to down since then,” Blitzer said. “Stable 2% inflation, continued employment growth, and rising wages are all favorable. Measures of consumer debt and debt service do not suggest any immediate problems.”


