After years of steady recovery in the housing market, home values have begun to decline, experiencing the largest single-month decline in November since housing recovery began, according to the latest data from Black Knight.
Home values fell 0.2% in November, down $580 for the month and marking the first time the market has seen a consecutive three-month decline since early 2012.
Now, the average home is down $1,361 in value since August 2018.
Black Knight also revealed that the annual rate of appreciation fell in November, down 4.9% from last year.
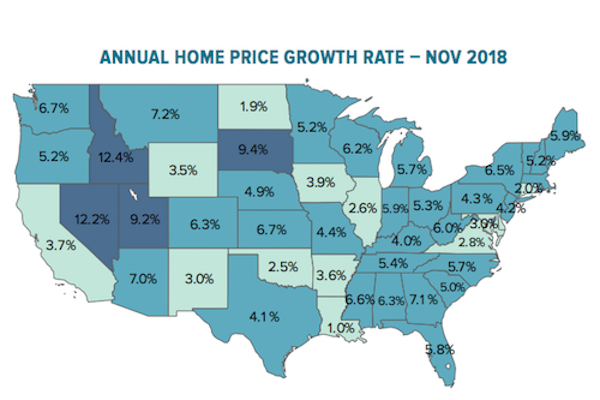
Still, home prices are up from 2017 in all 50 states and in 99 of the largest 100 markets, Black Knight said.
But the rate of growth is certainly slowing, a trend most obvious in the western part of the country.
In California, home price growth is now 3.7%, down from 10.3% just nine months ago.
Washington has also slowed, its current growth rate at 6.7% compared with 12.5% in February 2017.
Here is a map illustrating home price growth rates across the country as of November 2018:

(Source: Black Knight)


