As the economy strengthens, home values continue to appreciate, and that means homeowners are raking in the equity.
A report released Thursday by data analytics provider CoreLogic showed that home equity rose 12.3% year over year in the second quarter of 2018, meaning that the average homeowner saw their equity increase by $16,153 in one year’s time.
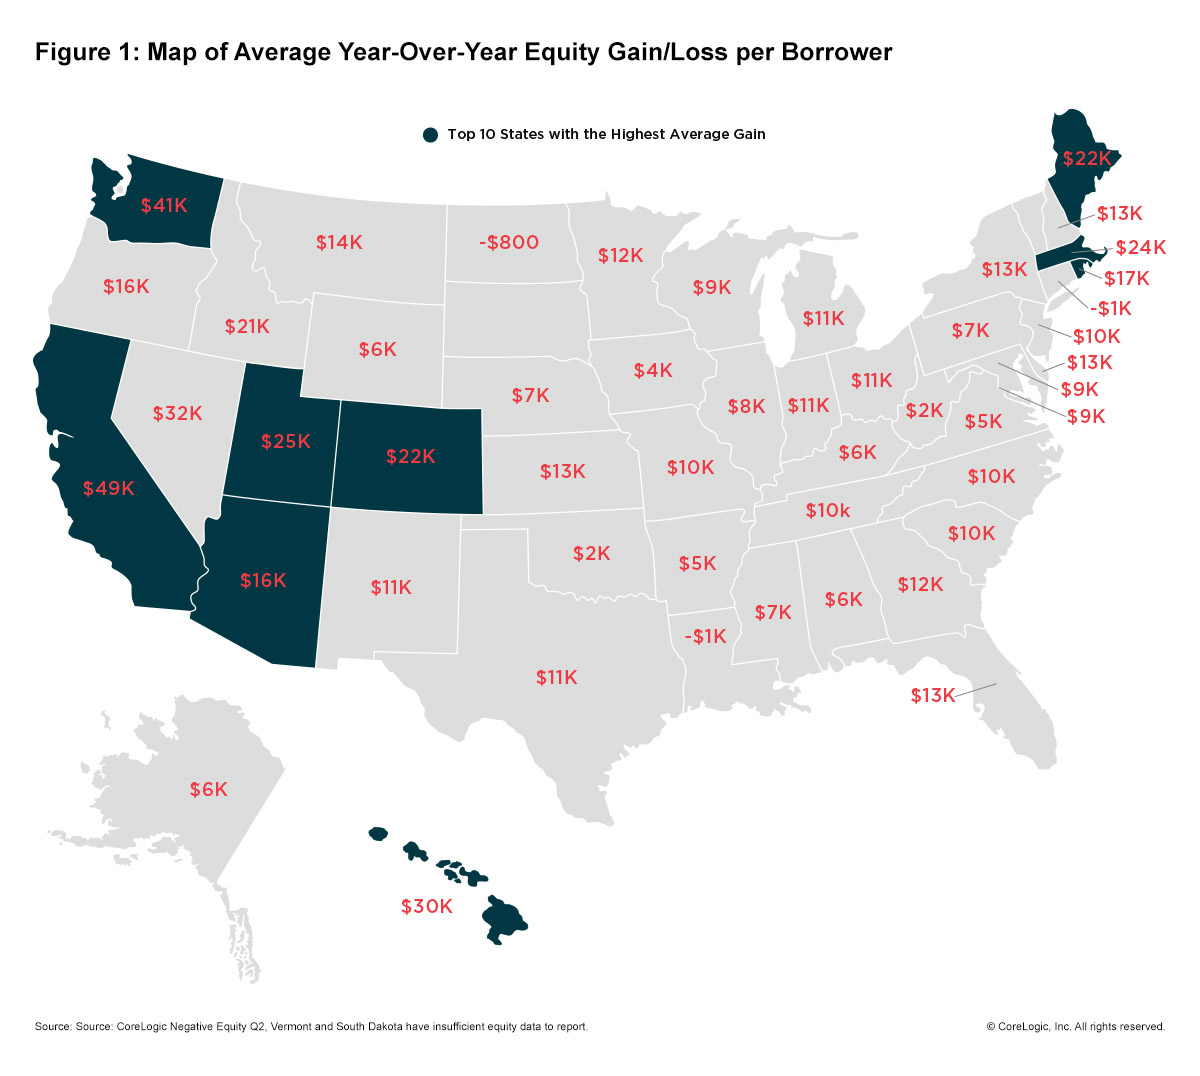
Home equity increased in almost every state, according to the report, with the western states showing the greatest gains.
California led the charge with an average gain of $48,800, followed by Washington with $41,100 and Hawaii with $29,600.
The report also looked at mortgaged homes with negative equity to determine how many properties in the U.S. are currently underwater, with homeowners owing more than the home is worth.
In the second quarter of 2018, it showed that negative equity fell 9%, so that just 4.3% of all mortgaged properties are upside down. In the fourth quarter of 2009, negative equity peaked at 26%.
CoreLogic Chief Economist Frank Nothaft said Q2’s totals mean aggregate home equity gains now total $1 trillion, and that consumers will likely funnel this money back into the economy.
“This wealth gain will support additional consumption spending and home improvement expenditures in coming years,” Nothaft said.
CoreLogic President and CEO Frank Martell said low inventory is contributing to price appreciation.
“Negative equity levels continue to drop across the U.S. with the biggest declines in areas with strong price appreciation,” Martell said. “Further, the relatively low level of shadow inventory contributes to the chronic shortage of housing supply and price increases in many markets.”
For a state-by-state breakdown, check out the two images below. Click to enlarge.
(Click to enlarge)
(Click to enlarge)


