

Following four consecutive month-over-month gains, home prices fell by 0.4% according to CoreLogic's August Home Price Index.
On a year-over-year basis, the index of national home prices, including distressed sales is down 4.4% from the previous August, a slight improvement from the 4.8% decline reported in July. When distressed sales are excluded, home prices declined 0.7% when compared to the previous year.
“Although the calendar says August, the end of the summer traditionally marks the beginning of 'fall' for the housing market as it begins to prepare for 'winter.' So the slight month-over-month decline was predictable, particularly given the renewed concerns over a double-dip recession, high negative equity, and the persistent levels of shadow inventory. The continued bright spot is the non-distressed segment of the market, which is only marginally lower than a year ago and continues to exhibit relative strength,” said Mark Fleming, chief economist for CoreLogic.
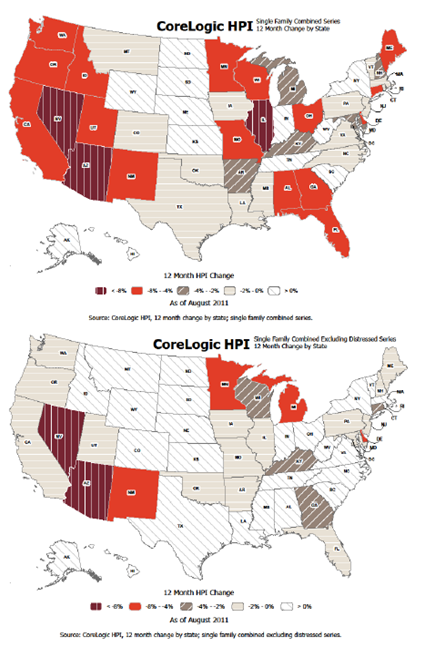
Bright spots in the August HPI were states that returned the highest level of appreciation. When including distressed sales, West Virginia (8.6%), Wyoming (3.6%, North Dakota (3.5%), New York (3.2%) and Alaska (2.2%) led the way. When distressed sales were excluded, the top five and percentages shifted to: West Virginia (10.7%), Mississippi (4.8%), Hawaii (4.4%), North Dakota (4.2%) and Kansas (3.7%).
On the down side, states with the highest depreciation, including distressed sales were: Nevada (-12.4%), Arizona (-10.7%), Illinois (-9.6%), Minnesota (-7.8%), and Georgia (-7.2%). Taking distressed sales out of the mix, the bottom five were: Nevada (-8.8%), Arizona (-8.3%), Delaware (-4.9%), Michigan -4.3%), and Minnesota (-4.2%).
On a national basis, home prices are down 30.5 percent from the peak reached in April of 2006 when distressed sales are included. Excluding those sales, the decline in the HPI was 21.0 percent in the same peak-to-current time period.

