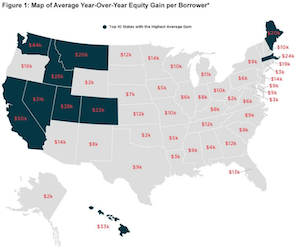
Homeowner equity topped $1 trillion in the first quarter of 2018, according to the Q1 2018 home equity analysis from CoreLogic, a property information, analytics and data-enabled solutions provider.
Homeowners with a mortgage, about 63% of all homeowners, saw equity increase by 13.3%, a total of $1.01 trillion, since the first quarter last year. The average homeowner gained about $16,300 in equity over the last year.
The total number of mortgaged residential properties with negative equity decreased 3% from the fourth quarter to 2.5 million homes, or 4.7% of all mortgaged properties. This is a drop of 21% from 3.1 million homes in the first quarter last year.
Home-price growth has accelerated in recent months, helping to build home-equity wealth and lift underwater homeowners back into positive equity the primary driver of home equity wealth creation,” CoreLogic Chief Economist Frank Nothaft said. “The CoreLogic Home Price Index grew 6.7% during the year ending March 2018, the largest 12-month increase in four years.
This chart shows which states saw the largest equity gains from last year.

(Source: CoreLogic)
The average growth in home equity was more than $15,000 during 2017, which is the most in four years. Washington led all states with 12.8% appreciation, and homeowners had larger home equity gains than the national average, according to Nothaft.
The value of negative equity in the U.S. at the end of the first quarter totaled about $284.8 billion. This is up $100 million from $284.7 billion in the fourth quarter.
“Home equity balances continue to grow across the nation,” CoreLogic President and CEO Frank Martell said. “In the far Western states, equity gains are fueled by a long run in home price escalation. With strong economic growth and higher purchase demand, we expect these trends to continue for the foreseeable future.”


