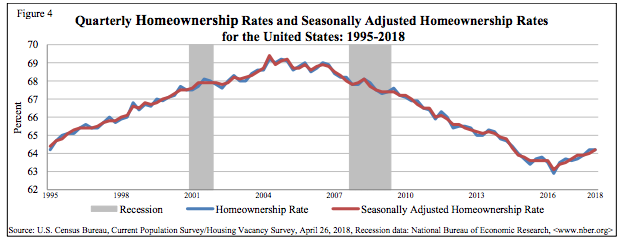
The homeownership rate was not statistically different from last year in the first quarter of 2018, according to the latest Quarterly Residential Vacancies and Homeownership report from the U.S. Census Bureau.
The homeownership rate increased just slightly to 64.2% in the first quarter, up from 63.6% in the first quarter of 2017 and unchanged from the fourth quarter, the report showed.
As the chart below shows, these rates remain significantly below historical levels and only began increasing once again in 2016.
Click to Enlarge
(Source: U.S. Census Bureau)
“Today's Housing Vacancies and Homeownership Survey data release for 2018 Q1 shows the homeownership rate ticked upward on a year-over-year basis for five consecutive quarters, but held steady from 2017 Q4,” Veritas Urbis Economics Founder and Chief Economist Ralph McLaughlin said.
Almost all age groups saw an increase in homeownership rate – except those at the youngest and oldest ends of the spectrum.
Millennials saw their homeownership rate fall once again as the rate for those under 36 years decreased from 36% in the fourth quarter to 35.3% in the first quarter. However, this is still up from 34.3% in the first quarter of 2017.
And one expert pointed out that even with quarterly drop, Millennials are still proving resilient amid difficult home buying conditions.
“Millennials have emerged as the most dogged homebuyers with those under 35 far outpacing the overall annual homeownership rate change, despite contending with the most vexing portion of the housing market,” Trulia Senior Economist Cheryl Young said. “Millennials make up the largest share of those seeking starter homes, a portion of the market that saw inventory plummet 14.2% and prices leap nearly 10% year-over-year in Q1 2017.”
Those ages 35 to 44 increased their homeownership rate from 58.9% in the fourth quarter and 59% in the first quarter of 2017 to 59.8% in the first quarter this year. Those ages 45 to 54 years increased from 69.5% in the fourth quarter and 69.4% last year to 70% in the first quarter. Those ages 55 to 64 years increased their homeownership rate from 75.3% in the fourth quarter to 75.4% in the first quarter. However, this was down slightly from 75.6% in the first quarter 2017.
But in the next age group, once again homeownership drops. For those ages 65 and older, the homeownership rate decreased from 79.2% in the fourth quarter and from 78.6% in the first quarter of 2017 to 78.5% in the first quarter this year.
Among all ethnic groups, and this should come as no surprise, Hispanics were the only demographic to see their homeownership rates grow both from last quarter and last year. Among the Hispanic population, the homeownership rate grew from 46.6% in the fourth quarter and in the first quarter of 2017 to 48.4% in the first quarter this year.
Why is this no surprise? Because last year a report from the National Association of Hispanic Real Estate Professionals showed the Hispanic homeownership rate accounted for 74.9% of the total net growth in the overall homeownership rate in the U.S.
The White homeownership rate decreased from 71.8% last year and 72.7% last quarter to 72.4% in the first quarter. The Black homeownership rate, while up slightly from 42.1% in the fourth quarter, decreased from 42.7% in the first quarter of 2017 to 42.2% in the first quarter this year. Finally, the Asian, Native Hawaiian and Pacific Islander rate decreased from 58.2% in the fourth quarter but increased from 56.8% last year to 57.3% in the first quarter this year.
The final driver of homeownership growth? As it turns out, vacancies have been decreasing, lending more inventory to the housing market.
“The decline in vacancy rate has been an important, though silent addition to the housing supply,” said Tian Liu, Genworth Mortgage Insurance chief economist. “Homeowner vacancy rate peaked in 2008 at 2.8%, and is now under 1.6%, adding significantly to the housing supply.”
“With vacancy rates now approaching the lowest level since the early-1990s, it troughed in 1993 at 1.4%, home prices will likely rise further, and the need for more affordable new homes is also greater,” Liu said.
The homeownership vacancy rate continues to decrease amid the highly competitive housing market. It decreased from 1.7% in the first quarter of 2017 and 1.6% in the fourth quarter to 1.5% in the first quarter of 2018.
“Given the number of existing homes for sale recently dropped to a record low, it is no surprise that the homeowner vacancy rate fell to 1.5% in the first-quarter, the joint-lowest rate for 24 years,” Capital Economics Property Economist Matthew Pointon said.


