CoreLogic, a global property information, analytics and data-enabled solutions provider, released a report outlining the real estate economy from 2006 to 2017, showing that the housing market has nearly completely recovered from the recent recession.
In some areas, residential areas began to hit their peak levels as early as 2005, according to the company's Evaluating the Housing Market Since the Great Recession report. The majority of home prices collapsed in 2007.
During the recession, home prices fell 33% nationwide, hitting their lowest in March 2011. Since then, home prices have risen once again by 51%. The average home prices is now 1% higher than its 2006 level and the average annual equity increase was $14,888 in the third quarter of 2017. This indicates the housing market has recovered in many parts of the U.S., according to the report.
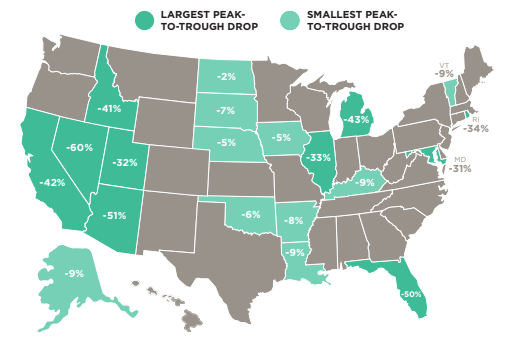
But while, overall, the U.S. has pushed past the recession, some states are still struggling to return to their pre-recession price levels. For example, Nevada saw the greatest drop after the housing crash as its home prices fell 60% from their peak levels.
Since then, home prices increased 93% from their trough, but remain 23% below their pre-recession peaks. What’s more, 9% of mortgaged properties in the state remained underwater as of the third quarter of 2017.
The chart below shows which states saw the largest plummet in home prices after the recession, and which ones were least affected.
Click to Enlarge
(Source: CoreLogic)
While some states saw their home prices fall drastically during the recession, others only experienced slight changes. North Dakota’s decline was just 2% due in part to the energy boom, and home prices in the state have since risen 48% above their previous peak.
“Homeowners in the United States experienced a run-up in prices from the early 2000s to 2006, and then saw the trend reverse with steady declines through 2011,” CoreLogic Chief economist Frank Nothaft said. “After reaching bottom in 2011, our national price index is up more than 50%.”
“West Coast states, such as California, Washington and Oregon are seeing some of largest trough-to-current growth rates in home prices,” Nothaft said. “Greater demand and lower supply, as well as booming job markets, have given some of the hardest-hit housing markets a boost in home prices. Yet, many are still not back to pre-crash levels.”
Local job market played a major role in determining the severity of the housing downturn at the regional level. Las Vegas, Miami and Chicago each arrived at their respective peaks at different times during the boom and experienced significant peak-to-trough home price declines during the recession. These markets have been slower to recover and their home prices are below their pre-recession peaks.
But other metro areas such as San Francisco and Denver, which both have technology sectors and low unemployment, experienced consistent home price growth. In the third quarter of 2017, the average year-over-year equity gain in San Francisco and Denver was $73,217, and $22,102, respectively, and only 1% of homes in those markets remained underwater.


