


Home prices reached an all new high across the U.S. in June, according to the latest index released from S&P Dow Jones and CoreLogic.
Nationally, home prices increased 5.8% from June 2016, up from May’s gain of 5.7%, to hit 192.6, an all new high, according to the S&P CoreLogic Case-Shiller U.S. National Home Price NSA Index, which covers all nine U.S. census divisions.
The 10-City Composite increased 4.9% annually, down from last month’s 5% annual increase, and the 20-City Composite increased 5.7% annually, the same as last month’s gain.
The chart below shows while the National Index reached a new high in June, the 10-City and 20-City Composites continue to rise, and are currently at their winter 2007 levels.
Click to Enlarge
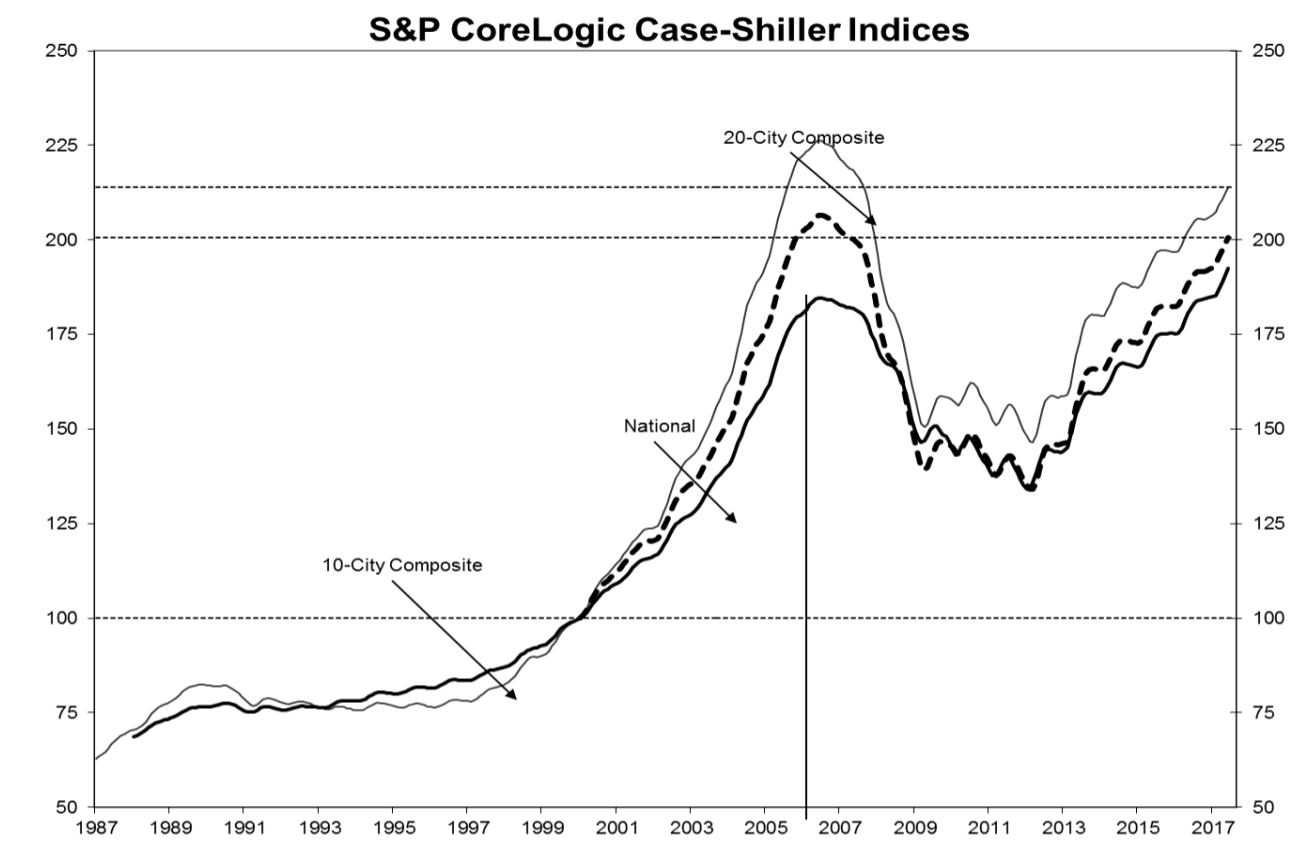
(Source: S&P Dow Jones, CoreLogic)
Seattle, Portland and Dallas reported the highest increases in June out of the nation’s top 20 cities with increases of 13.4%, 8.2% and 7.7% respectively. Overall, nine cities showed greater increases of the year ending in June versus the year ending in May.
“The trend of increasing home prices is continuing,” says David Blitzer, S&P Dow Jones Indices managing director and chairman of the index committee. “Price increases are supported by a tight housing market.”
“Both the number of homes for sale and the number of days a house is on the market have declined for four to five years,” Blitzer said. “Currently the months-supply of existing homes for sale is low, at 4.2 months. In addition, housing starts remain below their pre-financial crisis peak as new home sales have not recovered as fast as existing home sales.”
Before seasonal adjustment, the National Index increased 0.9% monthly in June, while the 10-City and 20-City Composites each increased by 0.7% in June. However, after seasonal adjustment, the National Index increased 0.4%, the 10-City Composite remained stagnant and the 10-City Composite increased just 0.1%. While all 20 cities saw a monthly increase before seasonal adjustment, after seasonal adjustment 14 cities increased.
“Rising prices are the principal factor driving affordability down,” Blitzer said. “However, other drivers of affordability are more favorable: the national unemployment rate is down, and the number of jobs created continues to grow at a robust pace, rising to close to 200,000 per month.”
“Wages and salaries are increasing, maintaining a growth rate a bit ahead of inflation,” he said. “Mortgage rates, up slightly since the end of 2016, are under 4%. Given current economic conditions and the tight housing market, an immediate reversal in home price trends appears unlikely.”


