Home prices finally surpassed all-time highs set in July 2006 as the housing boom topped out. But despite the steady build up to this the past few months, the new high isn’t necessarily a win.
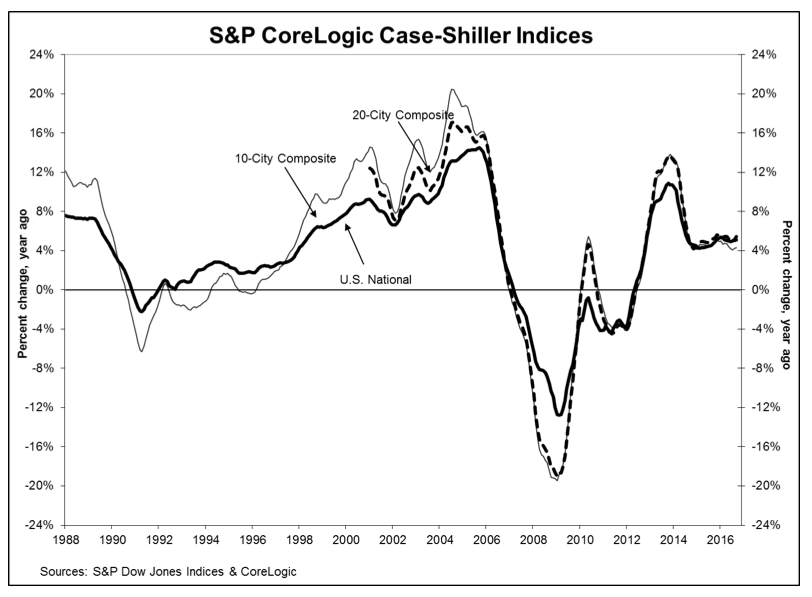
According to the latest data released Tuesday by S&P Dow Jones Indices and CoreLogic, the S&P CoreLogic Case-Shiller U.S. National Home Price NSA Index, which covers all nine U.S. census divisions, recorded a 5.5% annual gain in September, up from 5.1% last month.
The 10-City Composite posted a 4.3% annual increase, up from 4.2% the previous month, while the 20-City Composite reported a year- over-year gain of 5.1%, unchanged from August.
On a monthly basis and after seasonal adjustment, the National Index recorded a 0.8% month-over-month increase, the 10-City Composite posted a 0.2% month-over-month increase, and the 20-City Composite reported a 0.4% month-over-month increase.
The chart below show the annual returns of the U.S. National, the 10 -City Composite, and the 20- City Composite Home Price Indices.
Click to enlarge
(Source: S&P Dow Jones Indices and CoreLogic)
David Blitzer, managing director and chairman of the Index Committee at S&P Dow Jones Indices, highlighted, “The new peak set by the S&P Case-Shiller CoreLogic National Index will be seen as marking a shift from the housing recovery to the hoped-for start of a new advance.”
However, there’s a significant divide when looking at each city individually.
“While seven of the 20 cities previously reached new post-recession peaks, those that experienced the biggest booms — Miami, Tampa, Phoenix and Las Vegas — remain well below their all-time highs,” Blitzer said.
The report stated that Seattle, Portland, and Denver recorded the highest year-over-year gains among the 20 cities over each of the last eight months.
In September, Seattle led the way with an 11% year-over-year price increase, followed by Portland with 10.9%, and Denver with an 8.7% increase.
In addition, 12 cities reported greater price increases in the year ending September 2016 versus the year ending August 2016.
“Crossing this threshold is largely symbolic,” Trulia Chief Economist Ralph McLaughlin explained. “After controlling for inflation, home prices in the U.S. are still about 20% below the peak.”
Similar to Blitzer, McLaughlin stated that the recovery is not even across the board.
“The housing market recovery has been very uneven across the U.S. When controlling for inflation, markets that have reached their pre-recession peaks are few and almost exclusively in the West and South. And within those markets, it’s mostly high-end homes that have surpassed the peak,” McLaughlin said.
He added that while this is not so great news for homebuyers who have seen prices outpace incomes for most of the housing market recovery, it’s good news for homeowners who are no longer underwater.


