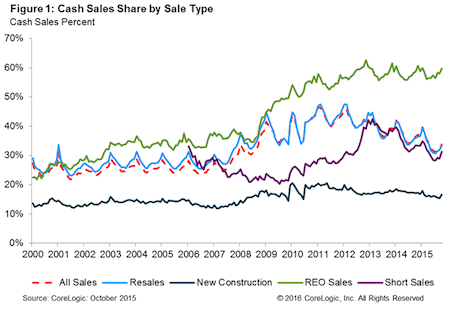
Cash sales accounted for 33.9% of total home sales in the month of October 2015, according to CoreLogic, compared to 36.4% in October 2014.
Cash sales increased by 1.4% compared to cash sales recorded in September, but that uptick is typical for October over September, CoreLogic reported. Further, the property data analytics firm said that the best gauge in determining cash-buyer trends is through yearly change, as opposed to focusing on month-to-month numbers.
When cash sales peaked in January of 2011, cash transactions accounted for 46.6% of total home sales nationally. Prior to the housing crisis, the cash sales share of total home sales averaged approximately 25%.
If the cash sales share continues to fall at the same rate it did in October 2015, the share should hit 25% by mid-2018.
Distressed sales, which include real estate-owned properties and short sales, accounted for 9.4% of total home sales nationally in July 2015, down 2.1 percentage points from July 2014 and down 0.4 percentage points from June 2015, CoreLogic reports.
REO cash sales share increased in October to 59.7%, short sales made up 31.3% and newly constructed homes at 16.7%. While the REO percentage of cash sales was high, REO transactions only accounted for 7.3% of all sales in October 2015. When cash sales peaked in January 2011, REO sales represented 23.9% of total home sales.
Click to enlarge
(Source: CoreLogic October 2015)
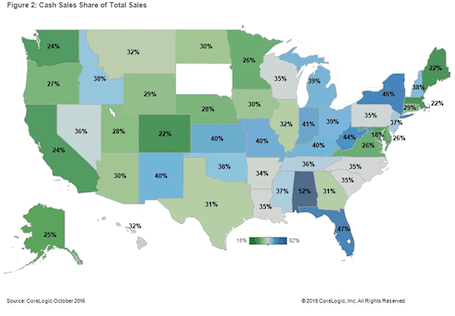
Per the report, Alabama had the largest cash sales share of any state at 51.7%, followed by Florida (46.7%), New York (46.3%), West Virginia (44.4%) and Indiana (40.8%).
Of the nation's largest 100 Core Based Statistical Areas measured by population, Miami-Miami Beach-Kendall, Fla. had the highest cash sales share at 51.6%, followed by West Palm Beach-Boca Raton-Delray Beach, Fla. (50.9%), Detroit, Mich. (50%), Fort Lauderdale-Pompano Beach-Deerfield Beach, Fla. (49%) and Philadelphia, Pa. (48.9%). Syracuse, N.Y. had the lowest cash sales share at 13.9%.
Click to enlarge
(Source: CoreLogic October 2015)


