When you think about a real estate team, you automatically think they must be more productive than individual agents, right? Not so fast.
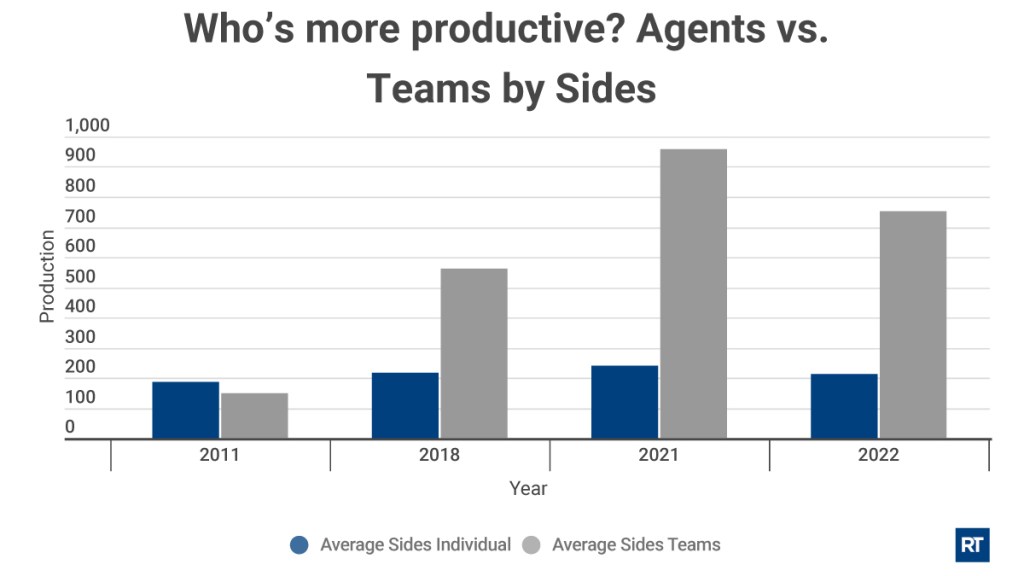
Clearly, over the last decade, teams have grown far faster than individual agents in terms of closed transactions. This is not unexpected, as teams have the ability to scale their business far easier and faster than an individual agent.
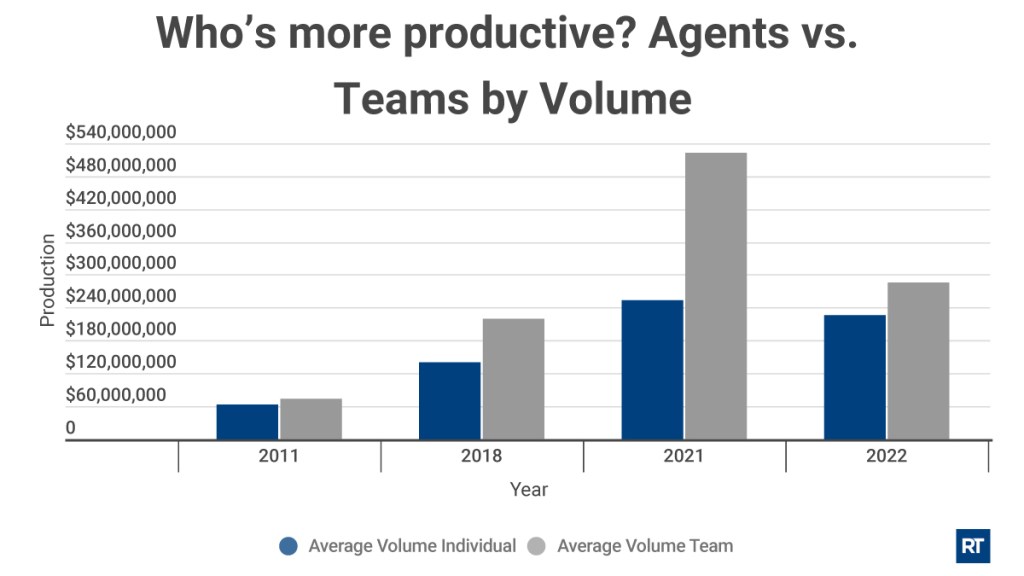
However, in terms of the average price of properties closed, our research shows that individual agents have the upper hand.
While most brokerage firms have embraced teams, some have not. This report can serve as guidance when choosing teams for your brokerage.
Production of teams vs. individual agents
RealTrends has provided verified ranking information since 2007 for individual agents and teams in the United States. These rankings are based on calendar year data submitted by these agents and teams and verified through third-party sources, often their brokerage firm or national brand network.
Starting in 2011, RealTrends started to compare the performance of the highest-producing 250 individuals with the highest-producing 250 teams. For this report, we looked at data from 2011 through 2022.
Teams win on per-person business increases
The 250 top-producing individual agents increased their per-person business by 13.9% in terms of closed transactions from 2011 to 2022. The 250 top-producing teams increased their per-team business by 405.4% in terms of closed transactions from 2011 to 2022.

When reviewing the median changes, the difference is not as stark. The top 250 individual agents median growth was 6% versus the top 250 teams at 240.7%, both well below the average change.
Volume growth rates show individual growth wins
Also, when looking at changes in volume the difference in growth rates was much closer. The top 250 individuals had average sales volume growth of 257.3% from 2011 to 2022 while the top 250 teams had average growth of 288.9% over that period. And when looking at median growth rates, the individual agents grew faster than the teams: 210.3% versus 117.0%.

While teams grew their closed transactions faster than individual agents, in terms of volume there was not much difference. Individual agents were selling higher-priced homes more frequently than teams did.
Clearly, over the last decade teams have grown far faster than individual agents in terms of closed transactions. This is not unexpected, as teams have the ability to scale their business far easier and faster than an individual agent.
Teams see average price of home sold decrease
However, in terms of the average price of properties closed, the report shows that it is individual agents who have had the upper hand. The top 250 individual agents saw the average price of the homes they sold increase by 761.6% from 2011 to 2022, while teams saw their average price decrease by 23.1% over that same period.
This last factor was likely influenced by teams focusing on general lead generation while individual agents are more focused on relationship-driven business. Higher priced homes are generally not the purview of those engaged in large scale lead generation.
The downturn of 2021 to 2022 tells an interesting story
Apart from reviewing the 2011 to 2022 results we looked at what happened in the first downturn of this period. And there we found some interesting trends.
Individual agents clearly outperformed teams. For example, the change in the average number of transactions for the top 250 individuals was down 11.6% from 2021 to 2022 while the top 250 teams suffered a decline of 21.5%; in median results, individual agents were down 16.6% while teams were down 38.5%.
Among these same top 250 rankings, individual agents were down 10.7% in average volume, while the top 250 teams were down 45.3% in average volume. These are startling findings, and we doubt anyone would have predicted these kinds of results.
Takeaways
Teams are able to scale their businesses to generate larger volumes of transactions than individual agents. That is not a surprise. What is a surprise is that individual agents are making up a significant part of that disadvantage by serving a higher-priced clientele. The data shows this conclusively.
And if the one year downturn is any indication, top individual agents operate more durable businesses than do team when the market turns negative.
Steve Murray is a senior advisor for HW Media and a partner with RTC Consulting. All data based on RealTrends + Tom Ferry The Thousand rankings from 2011-2022.


