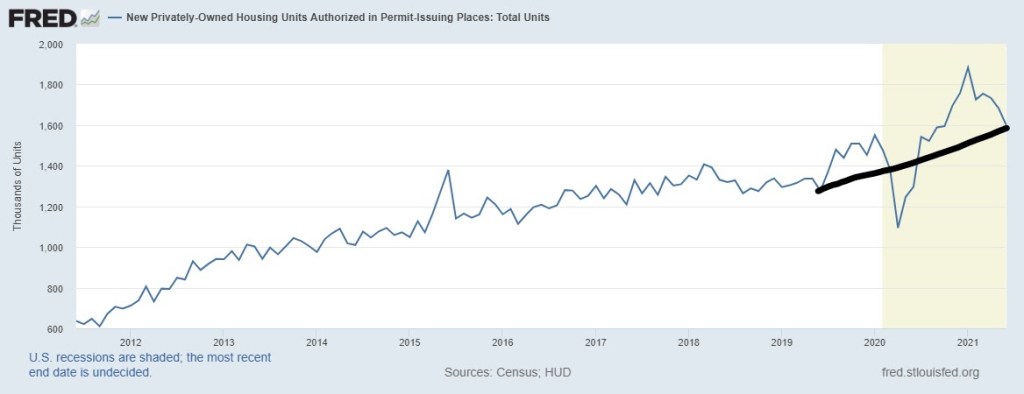
After an epic rise in housing starts and permits from the COVID-19 lows, the latest Census report shows a calm after the housing storm. This report is consistent with my prediction that all housing data will moderate from the epic run-up in activity in the second half of 2020.
This moderation means that 2021 will likely have slightly more total home sales than 2020, but not gangbusters. For me, that is completely fine; as I have stated many times, if total home sales close above 6.2 million in each of the years from 2020-2024, then you should view that as a beat. Housing has limits to what it can do demand-wise.
From the Census report:
“Privately‐owned housing starts in June were at a seasonally adjusted annual rate of 1,643,000. This is 6.3 percent (±11.5 percent)* above the revised May estimate of 1,546,000 and is 29.1 percent (±11.2 percent) above the June 2020 rate of 1,273,000. Single‐family housing starts in June were at a rate of 1,160,000; this is 6.3 percent (±11.7 percent)* above the revised May figure of 1,091,000. The June rate for units in buildings with five units or more was 474,000.”
Although the roller-coaster ride may now be over, the general uptrend in housing starts from the lows of 2018 is still intact. The new-home sector has held up well during this turbulent ride despite the higher construction costs that homebuilders have passed on to their customers. The new home sales sector is driven more by the mortgage market than the existing home sales market. Lower mortgage rates, therefore, are disproportionally benefiting recent home sales.
This is why even with the massive increase in cost to build and sell a home, things are holding together. When rates rise, that will be a different story, but not something in the works for 2021, as my peak bond yield forecast was 1.94%, and the lowest level was 0.62%. For now, that range has stuck in 2021.
Again from Census: “Building Permits Privately‐owned housing units authorized by building permits in June were at a seasonally adjusted annual rate of 1,598,000. This is 5.1 percent (±1.1 percent) below the revised May rate of 1,683,000, but is 23.3 percent (±0.9 percent) above the June 2020 rate of 1,296,000. Single‐family authorizations in June were at a rate of 1,063,000; this is 6.3 percent (±1.4 percent) below the revised May figure of 1,134,000. Authorizations of units in buildings with five units or more were at a rate of 483,000 in June.”
Like starts, housing permits have also moderated after performing the best out of all the housing data. The parabolic moves we saw in the housing data last year weren’t sustainable. The big swings upward were primarily due to makeup demand from the pause in sales due to COVID-19. Now the data line is working itself back to a more likely trend. A lot of economic data looks like this, so moderation in the data should have been expected.

The Housing Market Index (HMI) data, a measure of builder’s confidence, has also moderated. Considering the cost inflation in construction, builder’s confidence has held up much better than I thought it would. The existing low inventory has helped builders rationalize passing on the increased cost to their customers. As long as customers are willing to pay for it, builders will do it.
Builders’ confidence levels are near all-time highs, but I caution not to make too much of this. HMI should be analyzed as a rate of change rather than a number with historical context. The new home sales market can get materially worse with the index at near pre-cycle highs because there tends to be a lag in the data, so watch the direction of the trend for insight on current builder confidence.
In 2018, mortgage rates rising to 5% caused a material adverse change in the housing market, with monthly supply spiking over 6.5 months. The builder’s confidence index dipped consistently with the increased supply. Builder’s stocks went down more than 30% from their peak in response to the increased supply.
The mortgage rate increase did not create an accompanying spike in the supply of existing homes. Still, it did stop the downtrend in supply that we saw from 2014. Back in 2018, I wasn’t concerned that this negative material change would be long-standing because we were about to run into the best demographic patch for home purchasing ever recorded in U.S. history.
Remember my rule of thumb for predicting builder confidence: If monthly supply is below 4.3 months for the 3-month average, builder confidence is high, and life is good for the builders. We have been experiencing this for a good portion in 2020-2021 during the housing V-shaped recovery. With that low supply level, builders have the pricing power to do what they wanted and did. When supply reaches 4.4 months to 6.4 months, builder confidence is meh — and that is where we are now.
Today, the monthly supply is at the lower end of the channel we formed in the previous expansion, which was the weakest housing recovery ever. The current new home sales market is just ok. The builders will not want to overcommit to any new projects with passion. However, as long as new home sales can grow, slow and steady will win this race, like it was in the previous expansion.
If monthly supply gets to 6.5 months or above and new home sales are falling, then builders stop building to protect the value of their existing inventory. That is what happened in 2018. Demand picked up after that and things were ok, so don’t assume that every dip in sales or uptick in inventory is an impending 2008-style crash. One of the reasons why the housing bears from 2012-2021 have failed so badly is that they see every downward move as a foreshadowing of a housing collapse.
In the previous expansion, (2013, 2014, 2015, and obviously 2018) the new home sales sector was weak compared to the expectation. Because housing starts and new home sales were historically low, that sector was able to show growth due to the low bar for comparison. That is no longer the case. New home sales need to justify building more homes. I have talked about this before — why I don’t believe in a construction boom in America.
Today’s housing starts haven’t reached the short-term historical peaks of other cycles. Builders will only build more homes when they know they can sell them. Builders don’t care about the low inventory in the existing home sales market, which has picked up recently. They care about their own inventory. As long as this is understood, then the builders’ behavior seems rational. This sector may seem sleepy now, but keep your eyes open for the crumbs that mother economies lays out for us.


