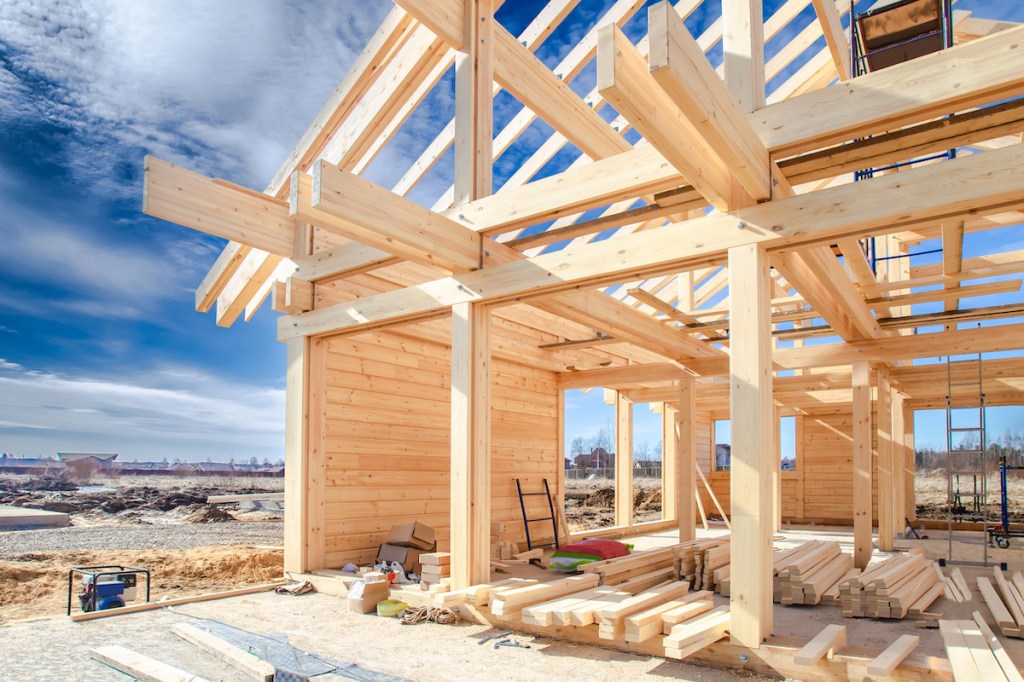
In a country with more than 330 million people, there are only 70,000 new homes available for sale today in the U.S. housing market. And with total active house listings in America near all-time lows, that is all we have for completed units for sale.
The number of new homes doesn’t ever get into the millions, but we are still working our way back to the pre-COVID levels of 80,000 to 100,000. As we can see in the chart below, the builders are getting back to a more normal range while their sales data have stabilized.

Why have the homebuilders’ stocks done so well recently? The builders are just moving product, doing whatever it takes to sell their homes and stabilize new home sales, and that is what we have seen in today’s new home sales report.
The new home sales report has been the same story for almost 18 months, with home sales stabilizing from a low level.
From Census: New home sales: Sales of new single‐family houses in April 2023 were at a seasonally adjusted annual rate of 683,000, according to estimates released jointly today by the U.S. Census Bureau and the Department of Housing and Urban Development. This is 4.1 percent (±11.8 percent)* above the revised March rate of 656,000 and is 11.8 percent (±15.1 percent)* above the April 2022 estimate of 611,000.

Last year, while the Census Bureau was reporting the new home sales numbers and the builders were having high cancellation rates, the monthly sales report didn’t account for the cancellations of contracts. This can make the monthly reports higher than normal, so taking that into consideration, the new home sales numbers were really low last year.
Last year, sale levels were meager and once mortgage rates fell and the builders were buying down rates to get more homes sold, the data stabilized and moved higher slowly. To give you an idea of the percentage of homes where the builders were giving a buy-down, the chief economist of the National Association of Home Builders, Robert Dietz, tweeted out this data line on Tuesday: “21 pct of builders used mortgage rate buy downs in April. It was 33 pct last Fall. More likely big builders.”
Looking at new home sales with an historical context, you can see that we weren’t working from a high bar last year on sales. So, the bar was very low to just have demand stabilize as rates fell, much like the existing home sales market. We also have a lot more workers now than what we did back in 1996 — the level where new home sales were trending last year.
Just like with the existing home sales market, all that is happening is that home sales stabilized from a low level.

This is different from the 2007 housing market when the builders’ sales were still collapsing and monthly supply spiked with rising cancellation rates. The opposite is happening now; cancellation rates have been falling from a high level and monthly supply is falling.
I have a straightforward model for when the homebuilders will start issuing new permits with some kick and duration. My rule of thumb for anticipating builder behavior is based on the three-month supply average. This has nothing to do with the existing home sales market — this monthly supply data only applies to the new home sales market, and the current 7.6 months are too high for the builders to issue new permits with any natural steam.
- When supply is 4.3 months and below, this is an excellent market for builders.
- When supply is 4.4-6.4 months, this is just an OK market for builders. They will build as long as new home sales are growing.
- When supply is 6.5 months and above, the builders will pull back on construction.
From Census: For Sale Inventory and Months’ Supply: The seasonally adjusted estimate of new houses for sale at the end of April was 433,000. This represents a supply of 7.6 months at the current sales rate.

When we talk about the monthly supply data, we need to break it into subcategories because the 7.6 months has confused many people.
- The Inventory for homes completed is at 70,000 = 1.23 months of supply.
- The Inventory for homes under construction is 263,000 = 4.6 months.
- The Inventory for homes that haven’t started yet is at 100,000 = 1.8 months
As you can see, we don’t have a lot of new homes ready to go — we have an abnormally high number of new homes still in construction and the builders don’t just ramp up production until they know they can sell those homes for a profit. I am skeptical of any big pick-up in housing permits until we exceed 6.5 months of supply and new home sales rise.
So, if you’re confused about housing still being in a recession while were supposed to have been in a bubble crash last year — only to see the builders doing OK with the data above, I don’t blame you. Traditionally, with a housing bubble crash, you don’t have new home sales stabilizing, cancellation rates falling, monthly supply falling and rising builders’ confidence. These economic data lines don’t happen when we are in a housing bubble crash year.
The real story is that active listings are still very low historically, the builders had and still have a significant backlog of homes to finish and get sold, and they’re working through that backlog. They can do this by cutting prices and buying down rates, as I believe they are efficient sellers.
Now that mortgage rates have hit 7%, the question is whether the builders can continue to keep this slow uptrend in sales going. The housing market has not responded well with 7% plus mortgage rates and this is now the third time this has happened since the big run-up in mortgage rates in 2022.


