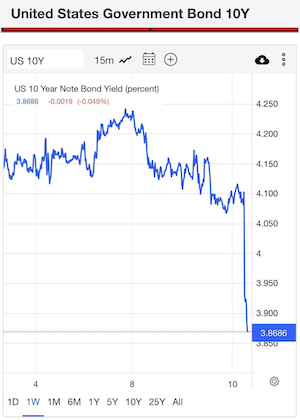
Finally, some good news: the growth rate of inflation is cooling off for now, and with the CPI inflation report being positive, the 10-year yield fell noticeably, and mortgage rates will fall with that! So, the question is, are we reaching the peak of inflation and close to the end of the Fed rate hike cycle? Let’s take a look at today’s data.
From the CPI report: The Consumer Price Index for All Urban Consumers (CPI-U) rose 0.4 percent in October on a seasonally adjusted basis, the same increase as in September, the U.S. Bureau of Labor Statistics reported today. Over the last 12 months, the all-items index increased 7.7 percent before seasonal adjustment.
The estimates for the CPI inflation data were for 7.9% year-over-year growth. Some people in the markets had speculated that the data would come in even hotter than anticipated —some whisper numbers were for 8.2% – 8.4% year-over-year growth. This of course led some people to believe that bond yields and mortgage rates would go much higher today.
However, the report came in at 7.7% — lower even than the forecast. As a result, mortgage rates went from 7.37% yesterday to 6.67% as of this writing.

On Thursday morning, the 10-year yield had a big rally, and bond yields headed lower (see above) and mortgage rates will be below 7% today. What a difference a year makes — now we’re excited to see mortgage rates getting below 7%! But it makes sense when you consider that over the last 52 weeks, mortgage rates have ranged from 3.14% to 7.37%.
One of my talking points with inflation data is that the biggest driver of core inflation is shelter, and this data line lags. It lagged back in August 2020 when it was still down, and it’s crawling now on the CPI data.
We already have more current data lines to show that the growth rate of inflation is cooling off. Some Federal Reserve members have commented on the fact that they know the shelter inflation data on the CPI lags — that’s a positive. Some people feared the Federal Reserve didn’t understand the lag in the CPI data, but this doesn’t appear to be the case.
So, we need to understand that the CPI shelter data lags, and the cooldown will be more of a 2023 story, especially in the second half of the year. Back in September, I went on CNBC before the CPI report came out to make this point and explain that shelter inflation did have legs to grow but the growth rate couldn’t be sustained.
Shelter CPI inflation data
As we can see in the graph below, the growth rate of shelter inflation is moving up and this has the potential to keep going higher. One thing to remember is that we have 910,000 two-unit housing that will come on line in 2023 and this will help cool the growth rate of inflation down next year. We already see the growth rate of shelter cooling off in the data lines that are more current, so this will be a positive story in 2023.
When this data line starts to cool down, it will be the biggest factor in core inflation cooling down. This is why I wrote about how we all need to root for housing completion data to get better so we get more supply into the marketplace. The best way to deal with housing inflation is more supply, and we have a lot of two-unit construction in the pipeline.
We see some inflation data cooling off recent peaks; food and energy are not part of core inflation data as they can have wild swings. As we can see below the growth rate of the Mad Max inflationary basket is cooling off, mostly due to energy prices coming off the recent highs.
Other inflationary data is also cooling off. We all know that used car prices exploded during the pandemic as supply crashed. That is already changing and has room to go lower. If you’re trying to defeat inflation by killing demand and losing jobs, you don’t have the proper supply in the market.
The history of global pandemics traditionally means supply chains are stressed for two years. Now that we are all walking the earth freely (outside of China), the production supply levels are returning to normal.
For today’s CPI report, the new vehicle price index, which also went parabolic during the pandemic, is coming down. Again, the best way to deal with inflation is to get more supply in the market.
So does this data represent a turning point? Have we seen the peak growth rate in inflation?
I would say this about this topic. Last year at this time the growth rate of a lot of inflationary data was still rising and then, on top of everything else, we had the Russian Invasion of Ukraine in February. Since then we have had massive Fed rate hikes in the system and the biggest driver of core inflation in America is set to cool down in 2023. Those facts are here today where they weren’t in November of 2021.
But, the Federal Reserve feels pressure to create a job-loss recession to get the inflation data back down toward 2% and even with today’s CPI inflation data being lower, they’re still going to push us into a job-loss recession.
I raised my sixth and final recession red flag as of Aug. 5, but I did write about two ways we could still avoid a nasty job loss recession. Here are two things that I would be looking for:
1. Rates fall to get the housing sector back in line.
Mortgage rates falling toward 5% can stabilize housing if they have duration. Traditionally, mortgage rates below 4% boost housing demand. The bleeding needs to stop and what we have seen in the data is that buyers did come into the housing market when rates got back down toward 5%.
However, 5% rates didn’t stay for long as the Federal Reserve found this to be counter-productive for their job loss recession to happen. We need to see lower rates and have it stick for some time for it to be more useful to get the housing market out of recession.
2. The inflation growth rate falls, and the Fed stops hiking rates and reverses course, as it did in 2018.
Some inflation data is already cooling off and will find its way into the data lines. However, rent inflation won’t come down in the data until 2023, even though we already see some change in that sector.
Since all my six recession flags are up, I am keeping a close eye on the jobless claims data, which rose today — this is the last data line that is preventing the economy from falling into a job-loss recession as so far, the honey badger labor market is holding up.
So for today, this is a small victory, but we will need many more months to change this economy.


