
[Editor’s note: As of November 2022, we no longer use Slack, and we’re happy to share that we’ve moved to Circle for our new community platform. We will be continuing Q&As, live discussions and more in this new community platform. If you’re a member and not a part of our Circle community yet, you can click the link at the end of the article to join.]
In this HW+ Slack Q&A, HousingWire Lead Analyst Logan Mohtashami gives the inside scoop on where rates are headed, his insights on the latest economic reports and more.
As a member of HW+, you get access to 30-minute Slack Q&As, where we invite the HW Media newsroom to break down the hottest topics in the industry. This Q&A was hosted in the HW+ Slack channel, which is exclusively available to members. To get access to the next Q&A on May 4th, you can join HW+ here.
The following Q&A has been lightly edited for length and clarity. This Q&A was originally hosted on April 20.
HousingWire: The best way to start is to talk about purchase application data. Can you break that down for us?
Logan Mohtashami: Yes, purchase application data has always been a useful forward looking indicator for housing, especially when we are dealing with higher mortgage rates. What have we seen this year? After making some Covid-19 adjustments to the data line, we will have our first negative year over year since 2014, unless something changes on the mortgage rate side.
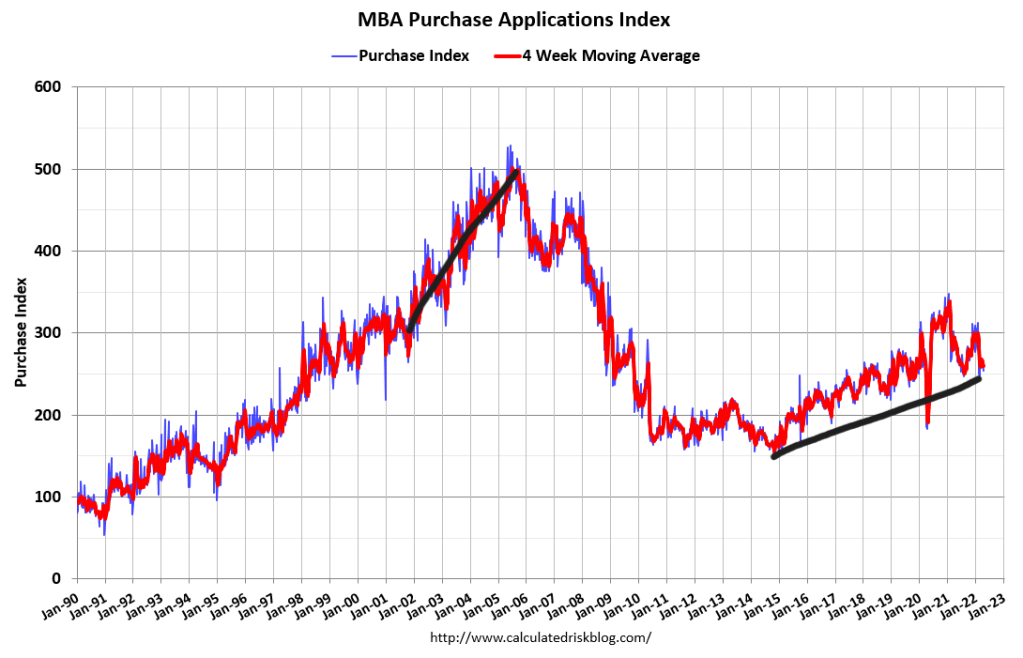
However, I would label this a mild decline so far for now:
- Week to week -3%
- Year over Year -14%
- 4 Week MA YoY -9.75%
In the last four weeks, the week-to-week data has had two positive and two mild negative prints. So not much action there, but the year over year 4-week moving average trend has been lower for sure. The last time we had 5% mortgage rates was in 2018. We only have three very mild negative year-over-year prints for all the hype of housing crashing back then.
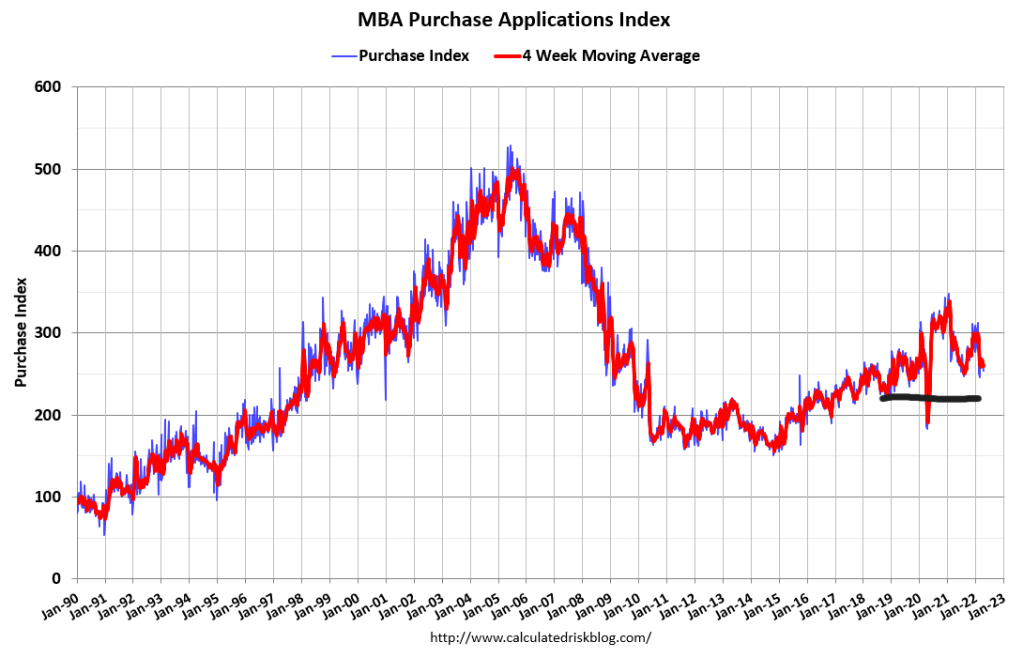
2014 was the last year we saw a noticeable weakness in purchase application data. The trend back then was 20% negative year over year data. When the application data gets weak or hot, it moves 20%-30% both ways.
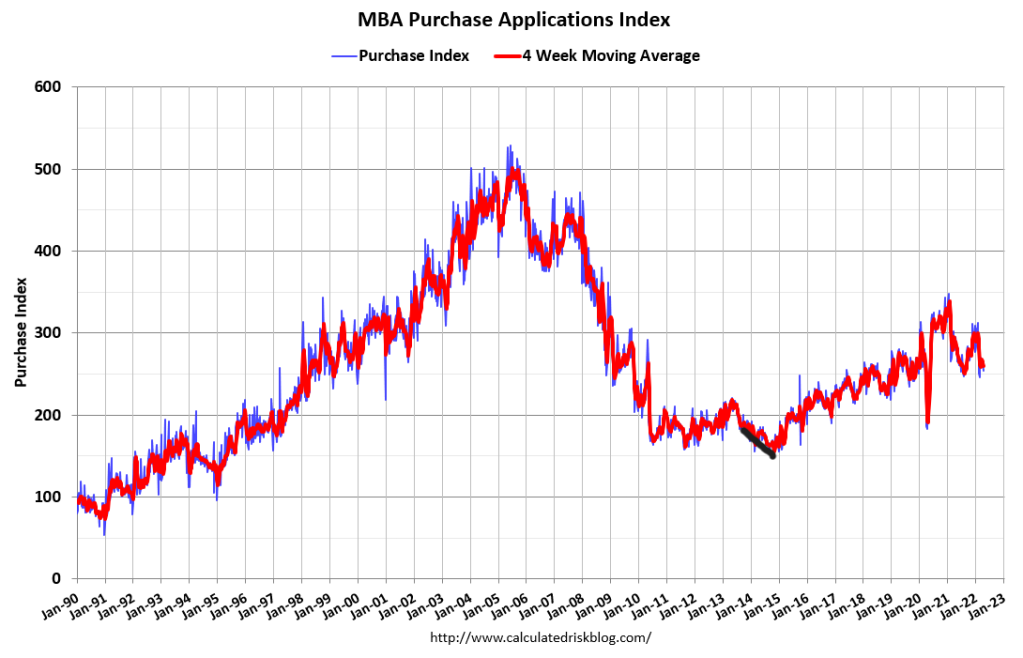
So, I would label this a mild decline in purchase application activity after making the Covid-19 adjustments. We have been mindful that the data we got with housing starts yesterday, and today’s existing home sales data is backward-looking.
HW+ Member: Do you expect 20-30% declines this year?
Logan Mohtashami: If rates stay above 5% with duration, we should have some prints this year at that level, but clearly, the trend hasn’t been that bad this year.
HousingWire: How are existing home sales trends and inventory affecting the housing market right now?
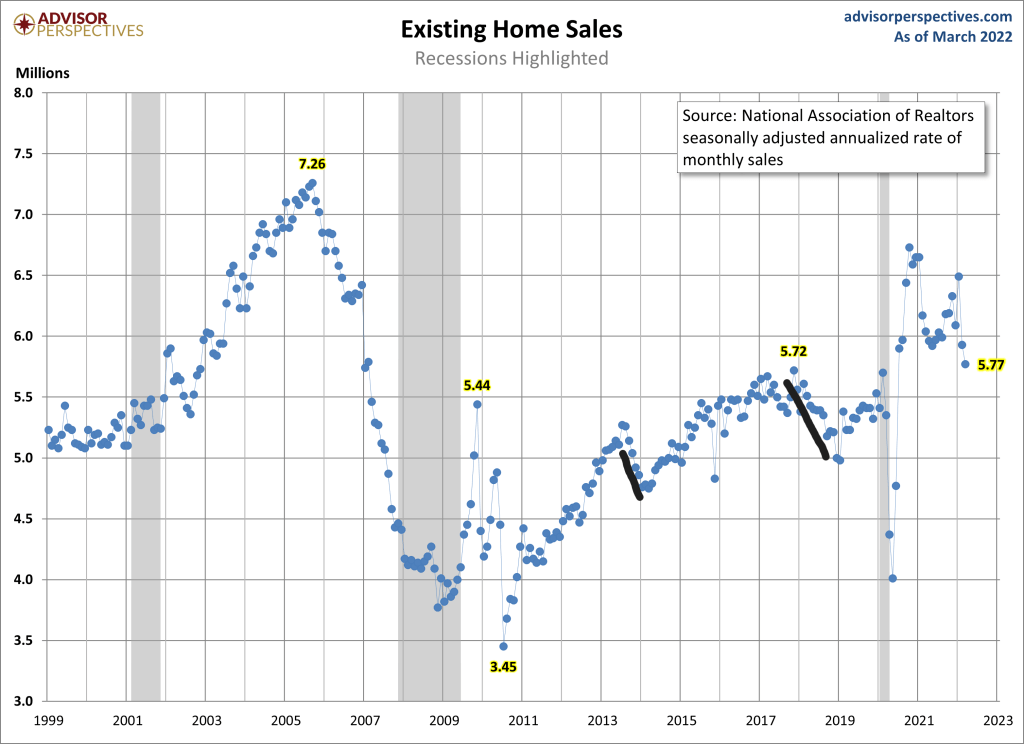
Logan Mohtashami: Existing home sales look about right to me this year; this was the pre 5% housing market. I was looking for sales to get 5,740,000 and have a few prints below that level to find our base sales. However, the 5%+ mortgage world means we have more downside activity than that.
As we can see below, when rates go higher, it does impact sales trends. At the end of 2017, we went from a 5.72 million sales trend to 4.98 million in January of 2019. Rates went lower in 2019, and sales rebounded toward the end of the year.
The main story of housing is that inventory got worse at the start of the year, and even this week, inventory levels are still showing negative year-over-year data. However, higher rates should create more days on the market, and we should be able to break the downtrend in negative year-over-year data we have seen this year.
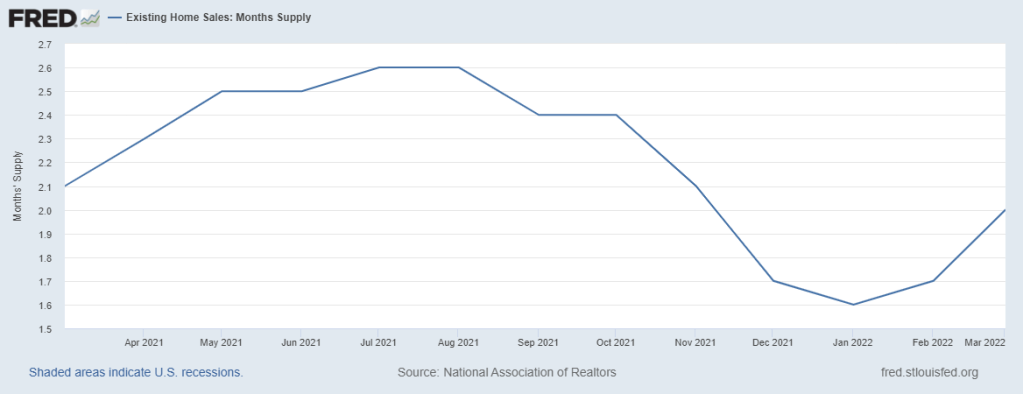
If that doesn’t happen with higher rates, we are in more trouble than I thought, and this inventory crisis has been my main reason for talking about unhealthy home price growth for some time now. However, traditionally higher rates do their thing, and we are working from shallow levels in 2022.
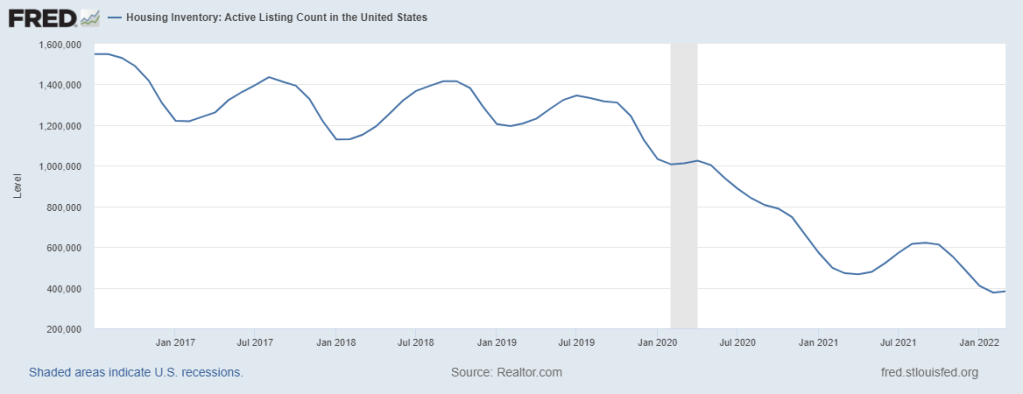
Inventory is very seasonal. It rises in the spring and summer and fades in the fall and winter. So, it’s essential to track the year-over-year data. Even if we get some positive inventory prints on a year-over-year basis, all this means is that we are still working from all-time low levels, but just a tad higher.
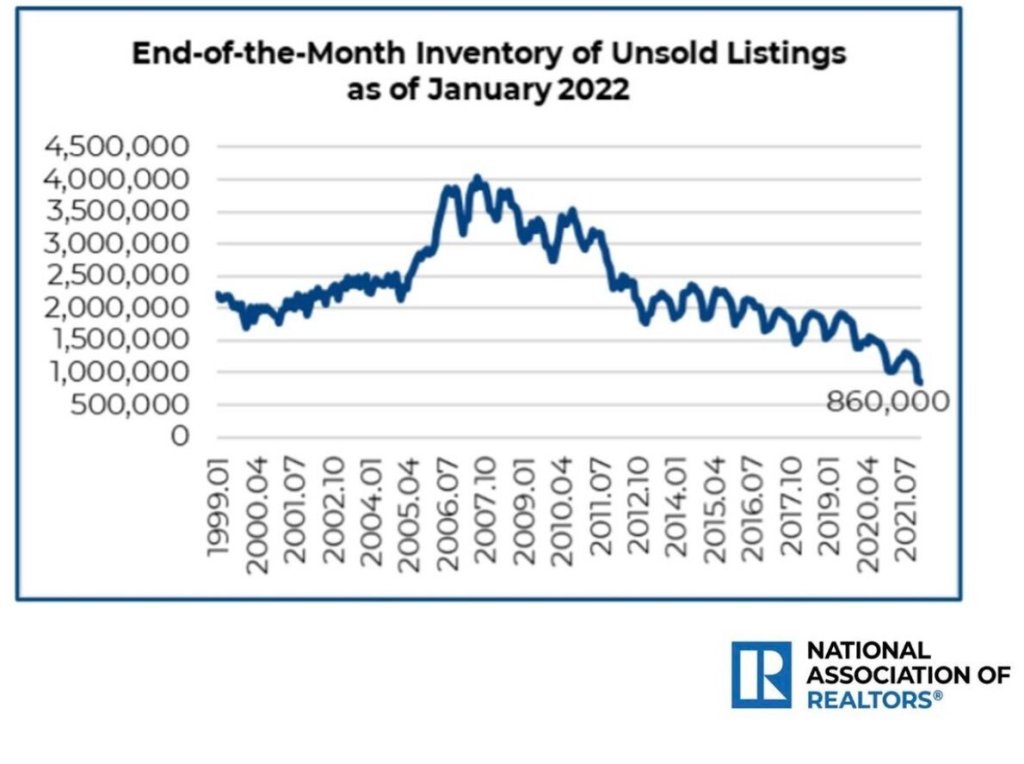
The goal I have had for some time is to get total inventory into a range between 1.52 million – and 1.93 million; this will make the housing much saner. Currently, based on the last NAR report, we are 950,000, so we got some work to do.
HousingWire: How are mortgage rates looking in comparison to earlier this year?
Logan Mohtashami: Mortgage rates, if you think about have made almost a 3% move higher from the recent lows of 2.50% that some people can get. 5.25% roughly right now; I know some can get higher or lower depending on the second pricing. However, this is the most positive housing story we have in 2022 because sub 4% mortgage and unemployment rates meant more unhealthy home price growth.
Today the NAR reported 15% median sales price growth, not a good thing folks. Home sellers and builders had too much pricing power, and as a collective whole, they were and are pushing it to the limits to make as much money as possible. higher rates have always been the stabilizing factor in this equation, and now that they’re here, they need to stick. We have seen a reversal in bond yields right now; the 10-year yield got as high as 2.98% and currently is down to 2.82.
For rates to stay at these levels, the economic data has to remain firm, not only here but worldwide. China is slowing down, and so is Europe. The U.S. economy has been solid, but we are starting to see cracks in the global inflation story. However, the Russian Invasion and the China lockdown is keeping some inflationary pressure that won’t be resolved until both those situations get closure.
The concern I have is that if those inflationary pressures fade and the economic data gets weaker, rates and bond yields fall again and whatever inventory we did see an increase gets taken off the market. This is actually might biggest concern for housing, So I know where I am is different from other people.
Take full advantage of your HW+ membership and join our exclusive Circle platform dedicated only to HW+ Members! To join the community, go here.
This article is part of our housing market update series. At the end of this series, you can join us on May 10 for a Housing Market Update webinar. Bringing together some of the top economists and researchers in housing, this event will provide an in-depth look at their latest insights on the housing market, along with a roundtable discussion on how this information applies to your business. To register for the HW+ event, go here.


