Don’t call it a comeback,
Good demographics and low mortgage rates have been here for years,
Rockin’ the bubble boys
Puttin’ the bears in fear
That’s a reference to the song “Mama Said Knock You Out” from L.L Cool J. I have used this in other articles and interviews, which runs in line with my big macro take that what drives the housing market are mortgage rates and demographics. So, you shouldn’t be surprised about what I am writing today.
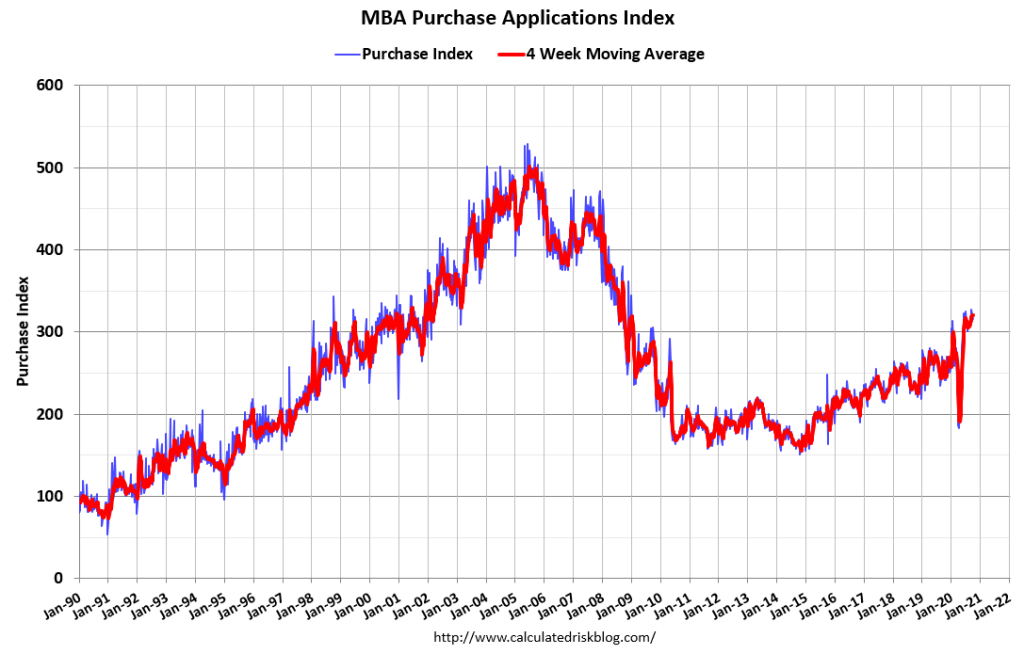
Today, purchase application data confirmed what I needed to see to justify that we should get a positive total existing-home sales year in 2020. Yes, as crazy as it sounds, we can do this for the existing home sales market in 2020.
I wanted to see at least 20 straight weeks of double-digit year-over-year growth on average to make up for the nine negative weeks we saw due to COVID-19. Those nine negative weeks came at a crucial time for the MBA purchase application data as it was right in the data line’s heat months. So, we had a lot of work to do to get back to the point where we can go positive, but it happened.

The MBA report shows the year-over-year growth for the last eight weeks has been +21%, +22%,+25%,+6%, +40%,+28% +33% and +27%. As you can see in the chart, these last eight weeks have created enough demand to move the total volumes higher than we would see during the heat months, which is during the second week of January to the first week of May. Since this data looks out 30-90 days, it’s enough demand to help the existing home sales market, which is still a negative year to date, to be positive for the year. The only thing that can stop this is some non-economic events at this stage since we are in October.
Also, throwing this out there. What happened to the ‘we have no homes to buy’ crowd, and the idea that credit is getting too tight? It looks like credit is getting tighter on the surface, and that we have no homes to buy. However, both ideas are incorrect, as I have been talking about all year. Once demand picks up, sales will pick as we have plenty of homes to buy to get sales back positive. I have also tried my best all year to try to debunk the tight credit thesis, which is a common fairy tale these days. More on that here.
While the Bubble Boys were talking smack that we were in trouble and the Forbearance Crash Bros were snarling at us, king demographics and low mortgage rates showed these kids who was really in charge. However, jobs are not done; let’s get 2020 into positive territory to show these overrated rookies who are the real bosses.


