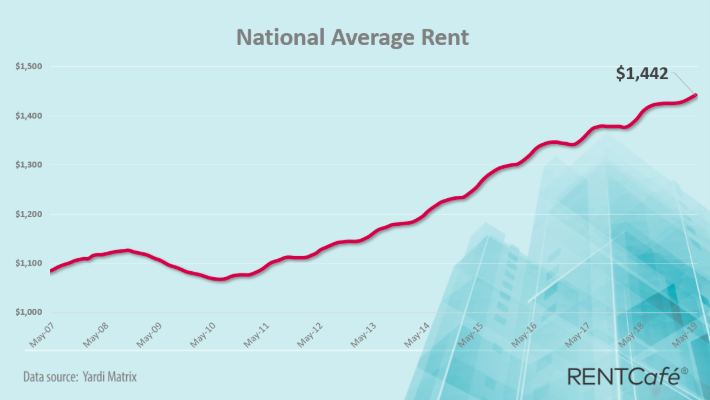
Despite rising rent prices in May, RentCafé indicates that about 70% of American cities are renting for less than the national average.
According to the company’s Apartment Market Report, the national average rent in May totaled $1,442. Not only is this a 2.5% increase from the previous month, but it is also $35 higher than the same period in 2018.
RentCafé’s data shows that 36% of the country’s largest 260 cities now have rents that exceed the national average. However, a whopping 64% of rents still fall below this average.
Once again, cities in the Midwest and the South continue to maintain relatively affordable rents, according to RentCafé.
“Most of the largest renter hubs analyzed are priced under the national average, while 6 of them are priced above $1,442,” RentCafé writes. “Renting in the most budget-friendly large renter hub, Indianapolis is now $863 after a $1 m-o-m increase. The second-most affordable renter hub is Columbus ($925), followed by San Antonio ($1,029) and two of the most in-demand cities to rent in: Phoenix, ($1,057) and Las Vegas ($1,066).”
So, where did May’s increases mainly happen? To no surprise, according to RentCafe’s data, rents predominately rose in New York and California.
“Apartment rents run the gamut across the country. Of the 260 largest cities analyzed in our report, 64% have average rents below, while 36% have average rents above $1,442,” RentCafé writes. “Averaging $647, rent in Wichita keeps at it as the most affordable in the U.S., followed by Tulsa with $691 and Toledo with $715. High-cost markets like Manhattan ($4,200) and San Francisco ($3,648) continue to display the highest average rents in the country.”
The image below shows monthly rent changes across the country:

NOTE: By utilizing rental data provided by Yardi Matrix, RENTCafe’s research team analyzed rent data across the 253 largest cities in the country. The report is based on apartment data related to buildings containing 50 or more units.


