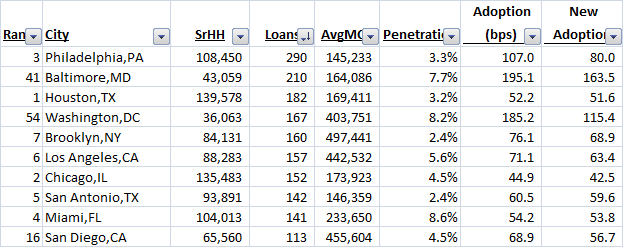
In this month's Industry Trends Report, Reverse Market Insight (RMI) provides some statistical analysis to examine the correlation between the number of senior households within a city, the penetration rate and the adoption rate.
The initial theory suggested that the cities with the highest populations would also be the cities with the highest number of senior households.

The theory held for the most part as 7 out of the top 10 remained in the the top 10. However, the order, based upon their rank by number of households, was rearranged. Additionally, 3 outliers, Baltimore, Washington, DC and San Diego, jumped into this top 10.
To examine performance, RMI created the "Adoption" rate by calculating the percentage of eligible households that completed a reverse mortgage in the first quarter of 2011 and computed the result on an annualized basis. The result is shown in the table as in basis points. "New Adoption" removes refinances to examine solely new reverse mortgages. Based upon this analysis, outliers Baltimore and Washington DC by far appear to be outperforming the rest of the top 10.
In terms of the penetration rate, all of the top 10 have rates that exceed the national average of 2.24%. However, the range is quite broad with San Antonio as the low end (2.4%) and Miami at the high (8.6%). The variance between the penetration rate, which is total overall activity and adoption rate, which is more current activity, may correspond more with current market dynamics than saturation.
In Miami, for example, it would be reasonable to suggest the the low adoption rate could be related more to the instability of the housing market than the penetration rate reaching a saturation point.
However, overall, RMI found a high correlation rate between penetration and adoption rates. Why this correlation exists could be due to multiple factors. The most obvious would be that the number of companies and originators targeting their marketing to the areas with the most senior households could also be created the most awareness of the product which may feed a comfort level to looking deeper into it. There could also be influence of current reverse mortgage holders sharing their experiences with others that helps drive additional interest.
When looking at this industry correlation, those responsible for allocating marketing dollars have an interesting quandary. Does this correlation at an industry level correspond with results at the individual marketing level? Or maybe a better question, how can the individual marketer leverage the industry success within a given market?


