One of the challenges in the housing market is lack of homes at lower price points. Builders, citing the high costs, have shied away from adding inventory of lower priced homes, helping them earn bigger margins. The truism — that a bigger payoff is available for comparable effort at higher price points — applies to agents as well. A few million dollar sales can help agents reach their targets faster than multiple sales at lower price points. Alas these big commissions are not available everywhere to the same extent. We set out to find where the big paydays are most likely around the country.
In the start-up world, companies valued at more than $1 billion are called unicorns. Even though they seem ubiquitous, there actually aren’t that many of them, and most start-ups are worth far less. The same can be said of homes over $1 million: They are far rarer than it seems, considering the amount of attention they get. That being said, some cities certainly do have larger concentrations of seven-figure homes, and we set out to find where they are are located.
In a recent analysis, we ranked the top 50 cities by the share of homes valued over $1 million as recorded in the My LendingTree property value database, which is a collection of real estate data for more than 155 million U.S. properties.
In the data, which you’ll find below, we also show the median home values to give an idea of the area’s typical home values.
Our data shows that housing unicorns follow start-up unicorns, with the tech-unicorn haven of San Jose, Calif., leading the pack, with a jaw-dropping 53.81% of homes exceeding the million-dollar mark. In fact, it’s the only area where the median home value also exceeds $1 million.
Its neighbor, San Francisco, also has strikingly high number, and every other place in our rankings falls far behind the high concentration of million-dollar homes in these two Bay Area metros.
Key findings
-
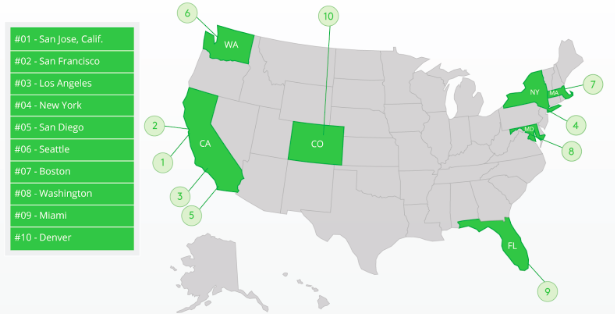
It’s like the California gold rush never ended, as the state is home to the top three places in our ranking. San Jose, San Francisco, Los Angeles and San Diego are also four of the only five metros where more than 10% of homes are valued at over $1 million.
-
Most cities in the top 10 are on the coasts, with the exception of Denver, which is the farthest inland.
-
The cities in the top 10 are known for having expensive housing markets in general. They all have median values above $300,000, except for Miami.
-
Rust Belt cities dominate the 10 places with the smallest concentration of million-dollar homes. These are also generally more affordable cities and have median values below $200,000, with the exception of Hartford, Conn.
-
Buffalo, N.Y., has the lowest share of homes over $1 million with only one out of every 1,000 homes passing the threshold.
Cities with highest share of million-dollar homes
#1 San Jose
Share of million-dollar homes: 53.81%
Median value of $1 million-plus homes: $1,505,000
Median value overall: $1,069,000
#2 San Francisco
Share of million-dollar homes: 40.03%
Median value of $1 million-plus homes $1,409,000
Median value overall: $891,000
#3 Los Angeles
Share of million-dollar homes: 17.23%
Median value of $1 million-plus homes: $1,419,000
Median value overall: $622,000
Cities with lowest share of million-dollar homes
#48 Hartford, Conn.
Share of million-dollar homes: 0.18%
Median value of $1 million-plus homes: $1,252,000
Median value overall: $223,000
#49 Pittsburgh
Share of million-dollar homes: 0.17%
Median value of $1 million-plus homes: $1,207,000
Median value overall: $149,000
#50 Buffalo, N.Y.
Share of million-dollar homes: 0.10%
Median value of $1 million-plus homes: $1,280,000
Median value overall: $141,000
Methodology
To determine the cities with the highest share of million-dollar homes, LendingTree looked at home value data in the 50 largest core-based statistical areas in the U.S. The analysis uses figures pulled on June 26, 2018 from the My LendingTree property value database. The database includes estimated home values for more than 155 million properties in the U.S., based on public tax, deed, mortgage and foreclosure data, as well as proprietary local data used to power home financing recommendations for My LendingTree users. LendingTree determined the concentration of million-dollar homes by dividing the number of homes in the area valued at $1 million or higher by the total number of homes in the CBSA.


