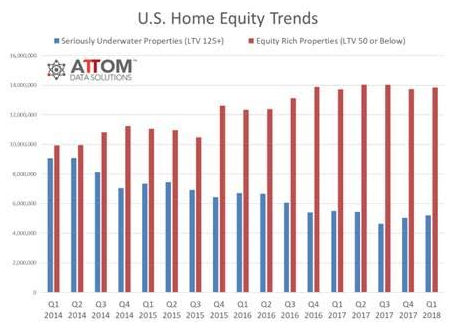
The first quarter of 2018 saw the smallest annual decrease in seriously underwater properties since ATTOM Data Solutions began tracking in the first quarter of 2013.
At the end of the first quarter of 2018, more than 5.2 million properties were seriously underwater, or the combined balance of loans secured by the property was at least 25% higher than the property’s estimated market value, according to ATTOM’s Q1 2018 U.S. Home Equity and Underwater Report.
This represents about 9.5% of all U.S. properties with a mortgage, up from 9.3% of all properties in the fourth quarter, but down from 9.7% in the first quarter of 2017, according to the report.
“We’ve reached a tipping point in this housing boom where enough homeowners have regained both sufficient equity and sufficient confidence to tap into their home equity, resulting in a noticeably slower decline in seriously underwater properties and slower growth in equity rich properties,” ATTOM Senior Vice President Daren Blomquist said.
“This tapping of equity could take the form of a cash-out refinance, home equity loan or simply a home sale,” Blomquist said. “We saw the biggest quarterly drop in average homeownership tenure for homeowners who sold in the first quarter since Q4 2008, evidence that more homeowners are reaching that equity-tapping tipping point more quickly and deciding to sell.”
The chart below shows the comparison of seriously underwater properties to equity rich properties dating back to the first quarter of 2014.
Click to Enlarge
(Source: ATTOM)
Equity rich properties, or properties where the combined loan amount secured by the property was 50% or less than the estimated market value, increased by 122,000 homes from last year to more than 13.8 million homes at the end of the first quarter. However, this is still down from last year’s peak of more than 14 million equity rich properties in the second quarter of 2017.
The number of equity rich properties at the end of the first quarter represents 25.3% of all properties with a mortgage. This is down from 25.4% in the fourth quarter but still up from 24.3% in the first quarter of 2017.


