[Ed Note: This economic forecast was first republished for quick access for LendingLife readers, with the permission of author and economist Mark Fleming. The original post can be read on the First American Economic Center Blog, right here.]
The Federal Open Market Committee (FOMC) meeting is just around the corner, and experts agree that an increase in the Federal Funds Rate is almost certain. In fact, the expectation of future Fed rate hikes is already putting upward pressure on mortgage rates. The benchmark 30-year, fixed-rate mortgage rate jumped three basis points to 4.4% this past week. Since the start of the year, the benchmark rate has climbed almost half a percentage point and has increased for eight consecutive weeks. Concern is growing about the impact of the rising mortgage rates on the housing market, but it is important to keep today’s mortgage-rate environment in perspective.
Let’s transport ourselves back to the early 1980s. In 1981, a prospective home buyer walking into a bank would have been offered a new 30-year, fixed-rate mortgage at a staggering 18% interest rate. Just four years earlier in 1977, that same bank would have offered the same mortgage for 8%. The four years between 1977 and 1981 witnessed the most dramatic increase in mortgage interest rates in the last 50 years. At its most extreme point in 1980, mortgage rates experienced a 50% year-over-year increase. The historically unprecedented increase had a devastating effect on the housing market – single-family home sales declined by 36% between 1979 and 1981.
What if Interest Rates Doubled?
Considering this historical context – is the housing market today as sensitive to mortgage rate increases as it was 40 years ago? How would a significant increase in the 30-year, fixed-rate mortgage rate impact the housing market today?
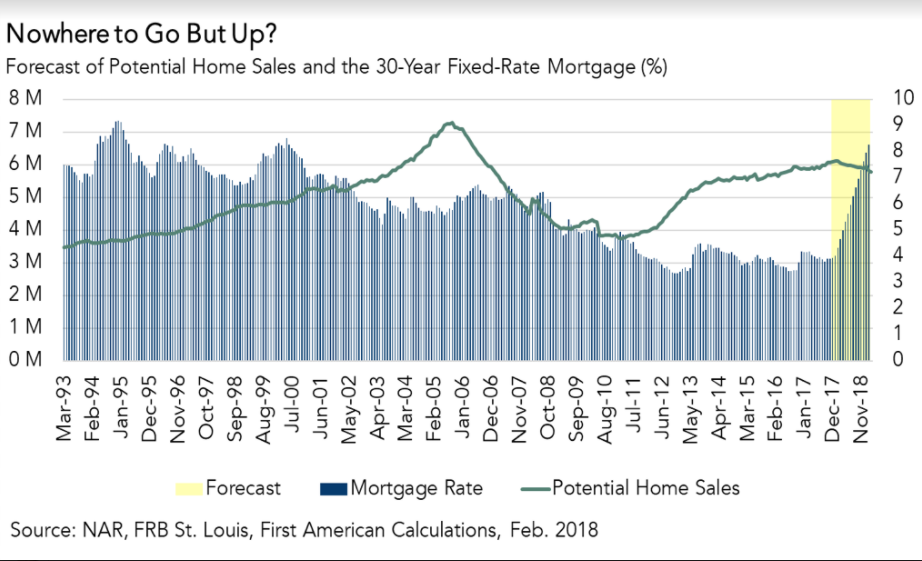
Fortunately, the answer is not as dramatic as many may think. In fact, using our Potential Home Sales model, we doubled the mortgage rate from its current value of about 4.4% to approximately 9% and the market potential for home sales declined from the current value of 6.1 million SAAR to 5.8 million SAAR. So, if mortgage rates doubled overnight, our model indicates a decline of just 300,000 sales, a mere 5% decrease.
Let’s be clear. Mortgage rates increasing to nearly 9% is extremely unlikely. There is no expectation of a mortgage rate increase of this magnitude. However, this scenario helps to put modest mortgage rate increases into perspective – they are unlikely to materially impact the housing market.
As we have previously discussed, economic conditions are favorable to consumers and helping increase consumer borrowing power. However, the healthy economic growth and strong labor market are increasing the risk of rising inflation, and rising inflation may spur the Fed to raise rates faster than currently expected. Yet, given today’s strong economy, our housing market is well positioned to adapt to rising mortgage rates.
February 2018 Potential Home Sales Model
For the month of February, First American updated its proprietary Potential Home Sales model to show that:
- Potential existing-home sales decreased to a 6.1 million seasonally adjusted annualized rate (SAAR), a 0.02% month-over-month decrease.
- This represents a 63.8% increase from the market potential low point reached in February 2011.
- The market potential for existing-home sales increased by 4.3% compared with a year ago, a gain of 253,000 (SAAR) sales.
- Currently, potential existing-home sales is 1.17 million (SAAR), or 16% below the pre-recession peak of market potential, which occurred in July 2005.
Market Performance Gap
- The market for existing-home sales is underperforming its potential by 3.4% or an estimated 210,000 (SAAR) sales.
- Market potential decreased by an estimated 1,300 (SAAR) sales between January 2018 and February 2018.
What Insight Does the Potential Home Sales Model Reveal?
When considering the right time to buy or sell a home, an important factor in the decision should be the market’s overall health, which is largely a function of supply and demand. Knowing how close the market is to a healthy level of activity can help consumers determine if it is a good time to buy or sell, and what might happen to the market in the future. That is difficult to assess when looking at the number of homes sold at a particular point in time without understanding the health of the market at that time. Historical context is critically important. Our potential home sales model measures what we believe a healthy market level of home sales should be based on the economic, demographic and housing market environments.
About the Potential Home Sales Model
Potential home sales measures existing-homes sales, which include single-family homes, townhomes, condominiums and co-ops on a seasonally adjusted annualized rate based on the historical relationship between existing-home sales and U.S. population demographic data, income and labor market conditions in the U.S. economy, price trends in the U.S. housing market, and conditions in the financial market. When the actual level of existing-home sales are significantly above potential home sales, the pace of turnover is not supported by market fundamentals and there is an increased likelihood of a market correction. Conversely, seasonally adjusted, annualized rates of actual existing-home sales below the level of potential existing-home sales indicate market turnover is underperforming the rate fundamentally supported by the current conditions. Actual seasonally adjusted annualized existing-home sales may exceed or fall short of the potential rate of sales for a variety of reasons, including non-traditional market conditions, policy constraints and market participant behavior. Recent potential home sale estimates are subject to revision in order to reflect the most up-to-date information available on the economy, housing market and financial conditions. The Potential Home Sales model is published prior to the National Association of Realtors’ Existing-Home Sales report each month.


