


Home prices increased in December, showing no letup in home price appreciation during the fourth quarter, according to the latest House Price Index from the Federal Housing Finance Agency.
Home prices increased 1.6% from the third to the fourth quarter, the report showed. This represents an increase of 6.7% from the fourth quarter of 2016. In December, home prices rose 0.3% month-over-month.
The chart below shows home prices have long since surpassed their previous peak, and continue to shoot up.
Click to Enlarge
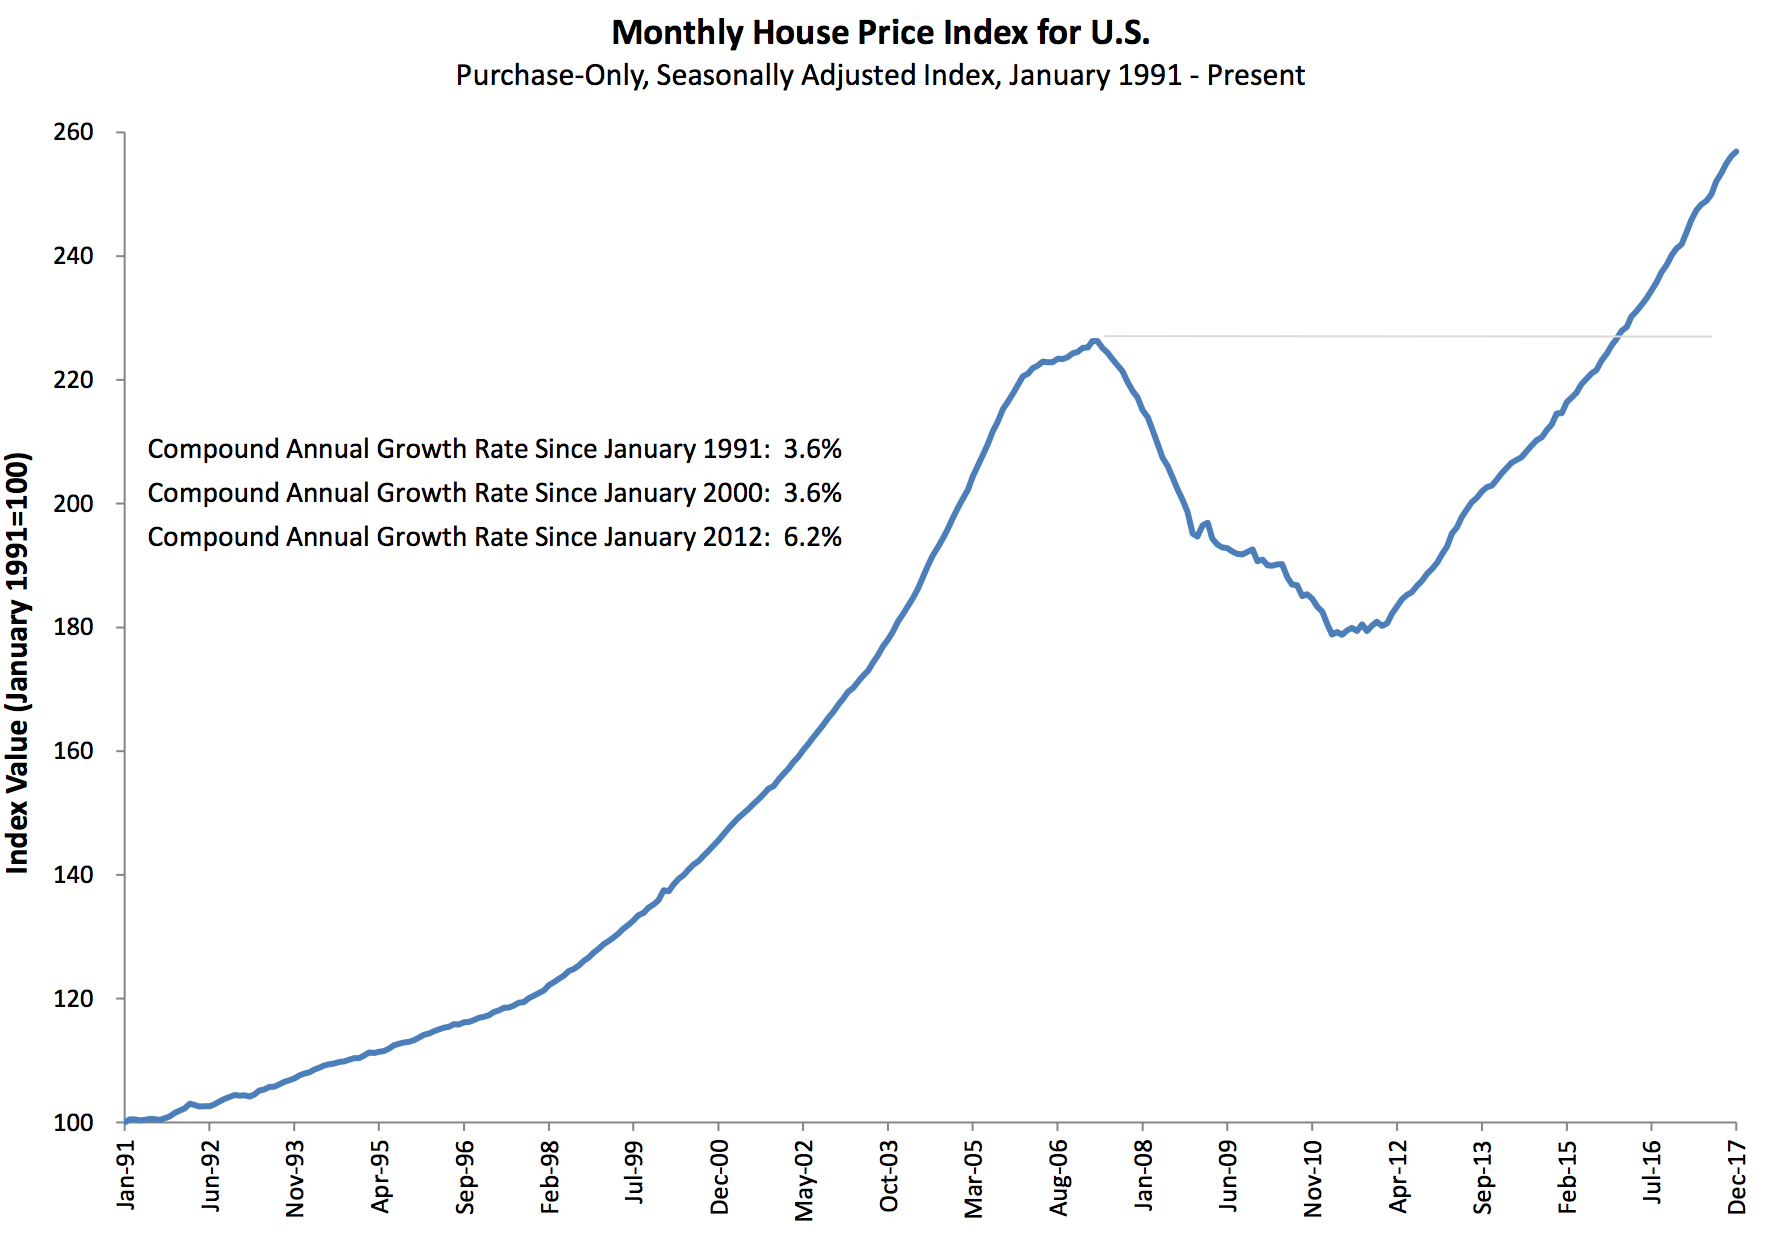
(Source: FHFA)
The FHFA monthly HPI is calculated using home sales price information from mortgages sold to, or guaranteed by, Fannie Mae and Freddie Mac. Because of this, the selection excludes high-end homes bought with jumbo loans or cash sales.
“Home price appreciation in the fourth quarter showed absolutely no letup throughout the U.S.,” FHFA Deputy Chief Economist Andrew Leventis said. “As we begin to evaluate home prices in the first quarter, we will monitor whether new headwinds—higher mortgage rates and changes in tax laws—will lead to any moderation in the rate of house price growth.”
The latest Case-Shiller report also showed similar increases, saying home prices rose 6.3% annually in December. But the report points out while home prices are indeed booming, the market could be beginning to show signs of a slowdown.
Home prices increased in nearly every state, with only Mississippi showing a decrease. Home prices rose in all of the top 100 metropolitan areas, with the Seattle area seeing the largest annual gain at 15%.
Of the nine census divisions, the Mountain division saw the strongest fourth-quarter appreciation, increasing 8.8% from the fourth quarter of 2016. It also saw the largest quarterly gain with its 2.3% increase.
On the other end of the scale, home price increases were weakest in the Middle Atlantic division, where prices rose 5.3% annually in the fourth quarter. The West North Central division saw the smallest quarterly gain with its increase of 1.36%.
Here is a list of which states are in each of those divisions:
Mountain: Montana, Idaho, Wyoming, Nevada, Utah, Colorado, Arizona, New Mexico
Middle Atlantic: New York, New Jersey, Pennsylvania
West North Central: North Dakota, South Dakota, Minnesota, Nebraska, Iowa, Kansas, Missouri


