There’s no question that the current real estate market favors sellers with its high home prices and low levels of inventory.
But even with these factors, buyers are continuing to jump into the market, diminishing what little inventory remains. In fact, buyers seem even more eager to enter the housing market than sellers.
To find out what markets are the best to sell a home, SmartAsset, a personal finance technology company, looked at five factors. Those factors included the change in median home value from 2011 to 2015 using data from the U.S. Census Bureau’s 5-Year American Community Survey, the average days spent on market, the percentage of homes sold for a loss, average closing costs and the number of real estate establishments per 1,000 residents found in the U.S. Census Bureau’s 2014 County Business Patterns Survey.
SmartAsset then ranked 161 cities with populations greater than 150,000, giving double weight to median home value. Each city then received a share from zero to 100.
Here are the top 10 best cities to sell a home and their scores:
10. Portland, Oregon – 72.82
Change in median home value: 0.79%
Average days on market: 57
Percent of homes sold for loss: 1.1%
Closing costs: $2,676
Real estate offices per 1,000 residents: 1.33
9. Dallas, Texas – 75.08
Change in median home value: 4.48%
Average days on market: 50
Percent of homes sold for loss: 2.4%
Closing costs: $2,472
Real estate offices per 1,000 residents: 1.01
8. Plano, Texas – 76.28
Change in median home value: 7.87%
Average days on market: 50
Percent of homes sold for loss: 0.6%
Closing costs: $3,097
Real estate offices per 1,000 residents: 1.01
7. McKinney, Texas – 78.53
Change in median home value: 10.67%
Average days on market: 50
Percent of homes sold for loss: 1%
Closing costs: $2,944
Real estate offices per 1,000 residents: 1.01
6. Aurora, Colorado – 81.01
Change in median home value: 3.45%
Average days on market: 28
Percent of homes sold for loss: 0.7%
Closing costs: $2,180
Real estate offices per 1,000 residents: 0.76
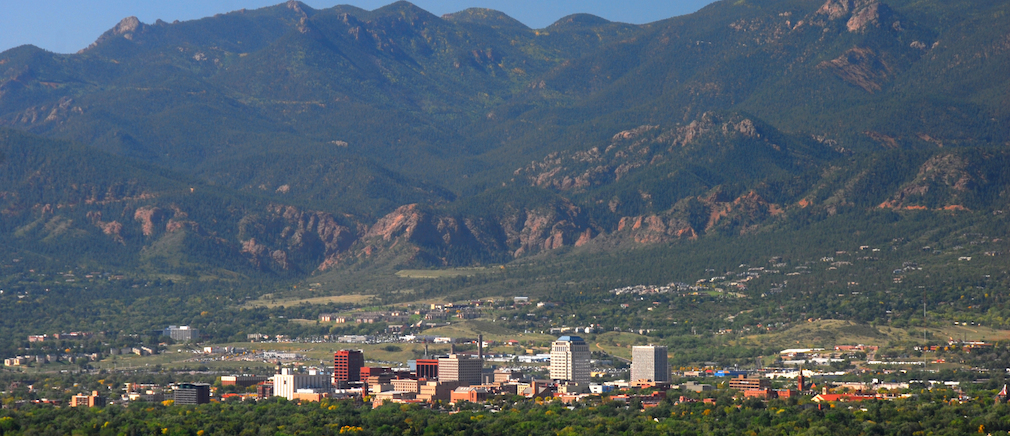
5. Colorado Springs, Colorado – 82.13
Change in median home value: 0%
Average days on market: 45
Percent of homes sold for loss: 2.2%
Closing costs: $2,295
Real estate offices per 1,000 residents: 1.47
4. Irving, Texas – 82.28
Change in median home value: 3.55%
Average days on market: 32
Percent of homes sold for loss: 1.3%
Closing costs: $2,517
Real estate offices per 1,000 residents: 1.23
3. Grand Prairie, Texas – 82.43
Change in median home value: 2.1%
Average days on market: 32
Percent of homes sold for loss: 1.5%
Closing costs: $2,419
Real estate offices per 1,000 residents: 1.23
2. Fort Collins, Colorado – 90.99
Change in median home value: 9.74%
Average days on market: 64
Percent of homes sold for loss: 1.5%
Closing costs: $2,422
Real estate offices per 1,000 residents: 1.68
1. Denver, Colorado – 100
Change in median home value: 11.46%
Average days on market: 27
Percent of homes sold for loss: 3.1%
Closing costs: $2,435
Real estate offices per 1,000 residents: 2.16


