In a case of reality-calling, more home sellers are reducing their prices in 2016 from their original listing price, especially in Texas, according to a report from online listing service Trulia.
Though home prices are rising, more reductions are being made from the original listing price. Reductions increased 0.52 percentage points over the past 12 months to 10.66% in September.
This could mean there is a softening in the market as buyers hit their ceiling of what they’re willing to pay. On the other hand, it could be a sign that sellers are over-pricing their homes. Or perhaps, it might be a little of both?
Whatever the reason, reductions increased in 70 out of the largest 100 metropolitan areas, especially in Texas. In fact, out of the top 10 metros, four are in the Lone Star State.
Here are the top 10 metros with the most increase in price reductions over the past year:
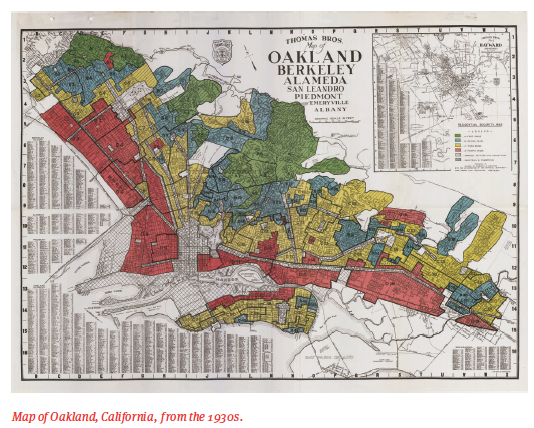
10. Oakland, California, increased, 4.4 percentage points from 2015’s 10% to this year’s 14.4%.
9. Oklahoma City, Oklahoma, increased 4.4 percentage points from 2015’s 10.5% to this year’s 14.9%.
8. Portland, Oregon, increased 4.7 percentage points from 2015’s 11.4% to this year’s 16.1%.
7. Denver, Colorado, increased 5.3 percentage points from 2015’s 13.5% to this year’s 18.9%.
6. San Jose, California, increased 5.3 percentage points from 2015’s 15.8% to this year’s 21.2%.
5. Fort Worth, Texas, increased 6.5 percentage points from 2015’s 5.7% to this year’s 12.2%.
4. Austin, Texas, increased 7.2 percentage points from 2015’s 8.5% to this year’s 15.6%.
3. San Francisco, California, increased 7.8 percentage points from 2015’s 13.6% to this year’s 21.3%.
2. Houston, Texas, increased 8.6 percentage points from 2015’s 8.5% to this year’s 17%.
1. Dallas, Texas, increased 10.7 percentage points from 2015’s 3.1% to this year’s 13.8%.
While some of the markets in California could be seeing a cool-down, it is more likely that sellers are simply over pricing their homes in cities like Dallas, which just started picking up speed in home price growth. In fact, a report that came out today from the Texas Association of Realtors shows that the market will not be cooling down any time soon.


