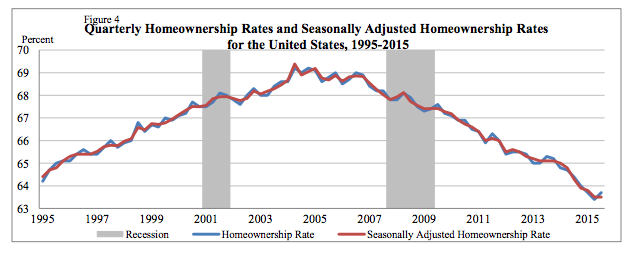
After dropping to the lowest level in 48 years in the last quarter, the homeownership rate in the United States increased during the third quarter, according to data from the Department of Commerce and the Census Bureau.
The latest quarterly report on residential vacancies and homeownership showed that the national rate of homeownership rose to 63.7% in the third quarter, climbing from 63.4% in the second quarter, which was a 48-year low.
The increase during the third quarter was the first time the homeownership rate increased in two years.
Despite the increase, the third quarter’s homeownership rate was still below the same time period last year, when the homeownership rate was 64.4%.
The overall increase came mostly from the Northeast region, where the homeownership rate rose from 60.2% in the second quarter to 60.8% in the third quarter.
The South also rose from 64.9% in the second quarter to 65.4% in the third quarter.
The West region also posted a small increase, rising from 58.5% to 58.7%, while the Midwest posted decreases in the third quarter.
According to the Census report, the homeownership rate in the Midwest fell in the third quarter from 68.4% to 68.1%.
The homeownership rate in the Northeast was lower than the rate one year ago, while the rates in the Midwest, South and West were not statistically different from the rates in the third quarter 2014, the Census Bureau said in its report.
Click the image below for the trend of homeownership on a national basis since 1995.
(Image courtesy of the Census Bureau)
Additionally, the Census Bureau report showed that the homeownership rate for householders 35 and younger rose in the third quarter, from 34.8% in the second quarter to 35.8% in the third quarter.
For householders from 35-44 years of age, the homeownership rate rose slightly, from 58% to 58.1%.
For householders from 45-54 years of age, the homeownership rate held steady at 69.9%.
For householders from 55-64 years of age, the homeownership rate fell slightly, from 75.4% to 75.3%.
For householders 65 years and older, the homeownership rate also rose slightly, from 78.5% to 78.7%.
The rates for householders 35 to 44, 55 to 64 and 65 years and over were lower than the third quarter 2014 rates, while the rates for householders under 35 and 45 to 54 were not statistically different from the rates a year ago, the report showed.
Additionally, The homeowner vacancy rate was highest outside metropolitan statistical areas (2.5%).
The rates inside principal cities (1.9%) and the suburbs (1.7%) were not statistically different from each other, the report showed.
The homeowner vacancy rate outside MSAs was higher than a year ago, while the rates inside principal cities and in the suburbs were not statistically different from the rates last year.
The homeowner vacancy rate in the South (2.1 percent) was higher than the rates in the Midwest (1.7%) and West (1.5%), but not statistically different from the rate in the Northeast (2%). The homeowner vacancy rate in the Northeast was higher than a year ago, while the rates in the Midwest, South and West were not statistically different from the rates last year.
Approximately 87.1% of the housing units in the United States in the third quarter 2015 were occupied and 12.9% were vacant.
Owner-occupied housing units made up 55.5% of total housing units, while renter-occupied units made up 31.6% of the inventory in the third quarter 2015. Vacant year-round units comprised 9.7% of total housing units, while 3.2% were for seasonal use.


