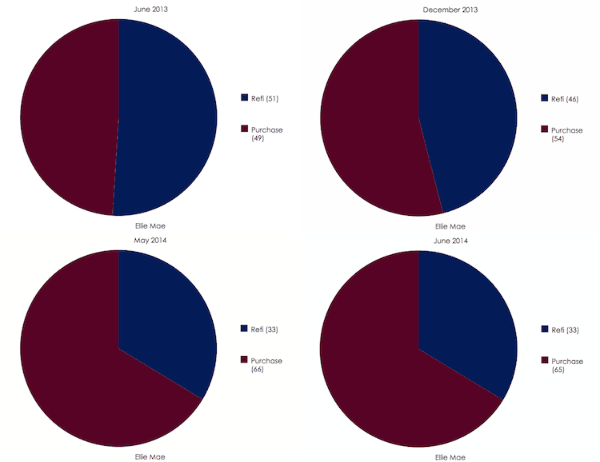
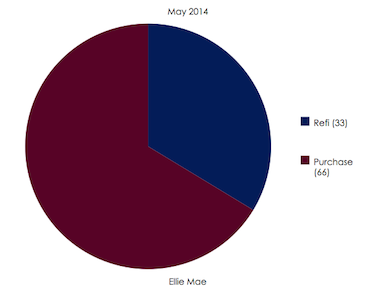
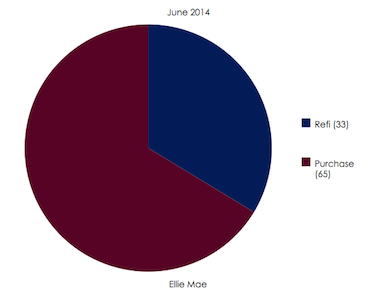
This year marked the first time since 2000 that the purchase market is dominating the mortgage market.
However, despite the dwindling share of refinance applications, mortgage rates continue to fall below last year’s levels, keeping the refinance business alive.
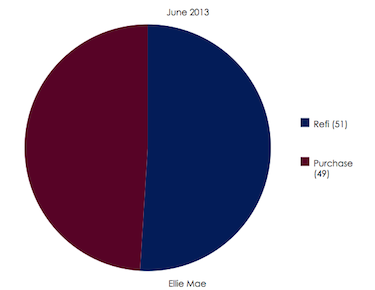
“While the market continued to be heavily purchase-oriented in June, the decline in interest rates may have contributed to the slight shift in the purchase/refinance mix in June,” said Jonathan Corr, president and chief operating officer of Ellie Mae.
“It may also have prompted more borrowers to select 30-year fixed-rate mortgages, which may be why the percentage of 15-year loans hit their lowest point for the year last month,” he added.
The most recent Freddie Mac Primary Mortgage Market Survey reported that the 30-year, fixed-rate mortgage averaged 4.13% for the week ended July 17, while the 15-year, FRM came in at 3.23%.
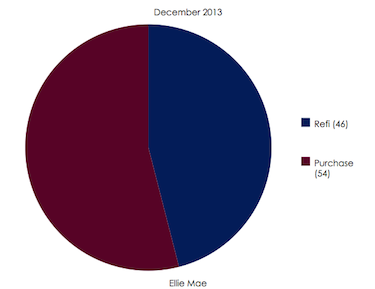
But the impact of all of this can best be seen in these four charts, information courtesy of Ellie Mae’s June Origination Insight Report.
(click page 2 to see each chart seperately)
(Click for larger image)


