When the U.S. Census Bureau released its new home sales data on Wednesday morning, it sent shockwaves through the industry. New home sales were down 14.5% from February’s rate to a seasonally adjusted rate of 384,000. The drop from March 2013 to March 2014 was 13.3%.
The non-seasonally adjusted figures show that there were 36,000 new home sales in March. That is down from March 2013, when 41,000 new homes sold. That’s a drop of 12.2%. And yes, that’s bad.
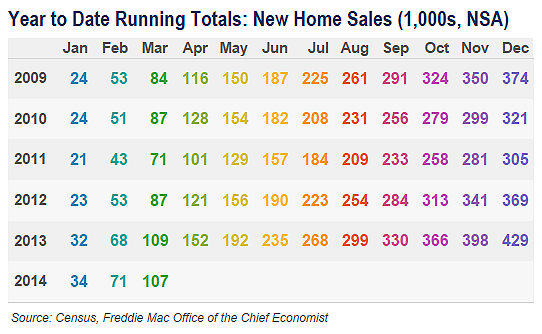
But if you look at the year-to-date totals, 2014 is only 2,000 home sales behind 2013. At the end of the first quarter in 2013, there were 109,000 total new home sales. The first quarter of 2014 had 107,000 new home sales. That’s only a 1.8% decline. Not so bad, right?
The year-over-year drop is much smaller because January and February 2014 were stronger than 2013. In January 2013, there were 32,000 new home sales. In January 2014, there were 34,000. In February 2013, there were 36,000 new home sales. In February 2014, there were 37,000 new home sales.
This infographic from Freddie Mac helps to illustrate how the decline is not quite as bad it appears.

In looking at the pricing segments of new homes sold, you begin to see where March’s decrease is really coming from. There was a 50% decline in new homes sold for under $150,000, from 4,000 to 2,000. Homes that sold for between $150,000 and $199,999 also fell by 25% from 8,000 to 6,000.
The largest decrease in the number of homes sold was for homes priced between $200,000 and $299,999, which saw a decrease of 3,000 from 2013. That drop was nearly 22%.
Homes priced from $300,000 to $399,999 actually increased by 1,000 from March 2013’s total, from 8,000 to 9,000. Homes priced from $400,000 to $499,999 were also up from 2013. March 2014 saw 5,000 homes sold in that segment versus 3,000 in March of last year.
The full Census report can be seen here.
So maybe the news isn’t quite as bad as it seems, but April’s figures might truly tell the tale of whether 2014 will be good for housing or not. If April’s figures show a precipitous drop from 2013, then we might really be in trouble. April and June were the best months for new home sales in 2013. In each month, there were 43,000 new home sales.
These spring months are crucial to the home buying market. March’s numbers aren’t great, but let’s not cry ourselves to sleep quite yet. April’s the month for showers anyway, right?


