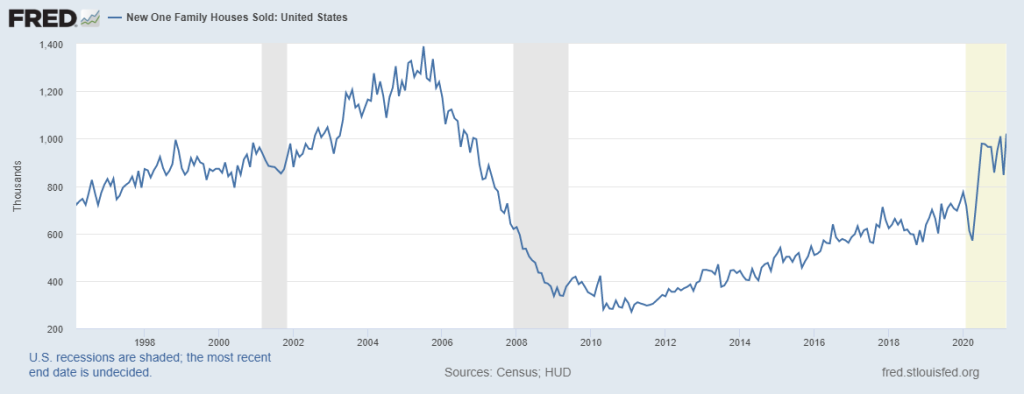
Today the Census Bureau reported that in March 2021, new home sales were at a seasonally adjusted annual rate of 1,021,000. This number beats estimates.
Additionally, major positive revisions were made to the sales number of the previous months. I expect this month’s headline to be revised lower a tad next month, but even considering that, this report was the best new home sales report in over a decade. The headline number was solid, the revisions were all positive, and the monthly supply on a three-month average is below 4.3 months.
New home sales get impacted much more than existing home sales by movements in mortgage rates. Mortgage rates from 4.75% to 5% created a supply spike in 2018. At that time, we worked from the weakest new home sales and housing starts recovery ever, and sales were not high, historically speaking. My forecast for the bond market was that it would fall in 2019, and if world growth slowed down, the 10-year yield would get below 2%. This would drive mortgage rates much lower than the 5% levels of 2018.
As you can see below, today’s monthly supply looks much different from what it did at the start of 2020. Demand is better now than any time from 2008-2019. During that period, we never had a monthly supply below 4.3 months with rising sales.
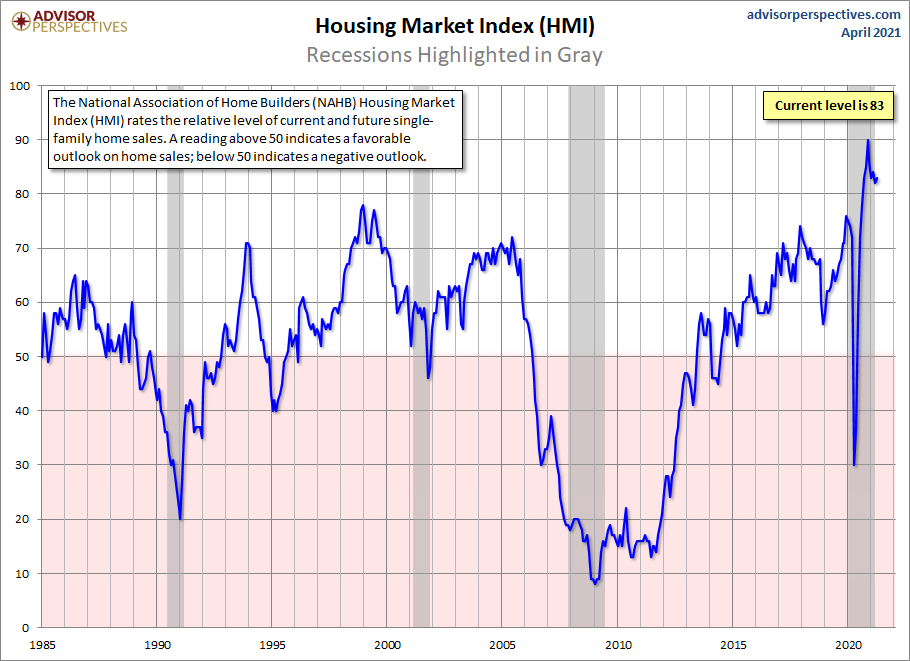
The most critical housing data line to follow in this housing market is the trend in monthly supply for the new home sales market. When the monthly supply is 4.3 months, and below, builder confidence is high. When supply is between 4.4 to 6.4 months, builder confidence is just meh for new construction. As long as new home sales can grow, construction can happen.
When supply is 6.5 months and over, builders will pull back from construction because demand no longer warrants more construction. The baseline supply I use to gauge conditions is a three-month average. We are currently at 3.86 months. For the last three months, supply has been 3.6, 4.4, and 3.6 months. When demand for new homes is really good, the monthly supply should be this low; we didn’t have this from 2008-2019, hence why housing starts grew slowly like how my tortoise moves from room to room.
Remember that new home sales and housing starts can vary widely month to month, and those numbers are highly susceptible to revisions, both positive and negative. We are likely to get some negative revisions to the numbers in this report, so it is more helpful to focus on the trend. The trend is your friend.
As long as the monthly supply stays below 4.3 months, like what we had for a good portion of 1996 to 2005, builder confidence will remain high, and they will continue to build. I don’t consider the housing data from before 1996 because too much has changed for those numbers to be relevant to our current economic models. The U.S. economy is more mature and developed than it was from 1960 to the 1990s.
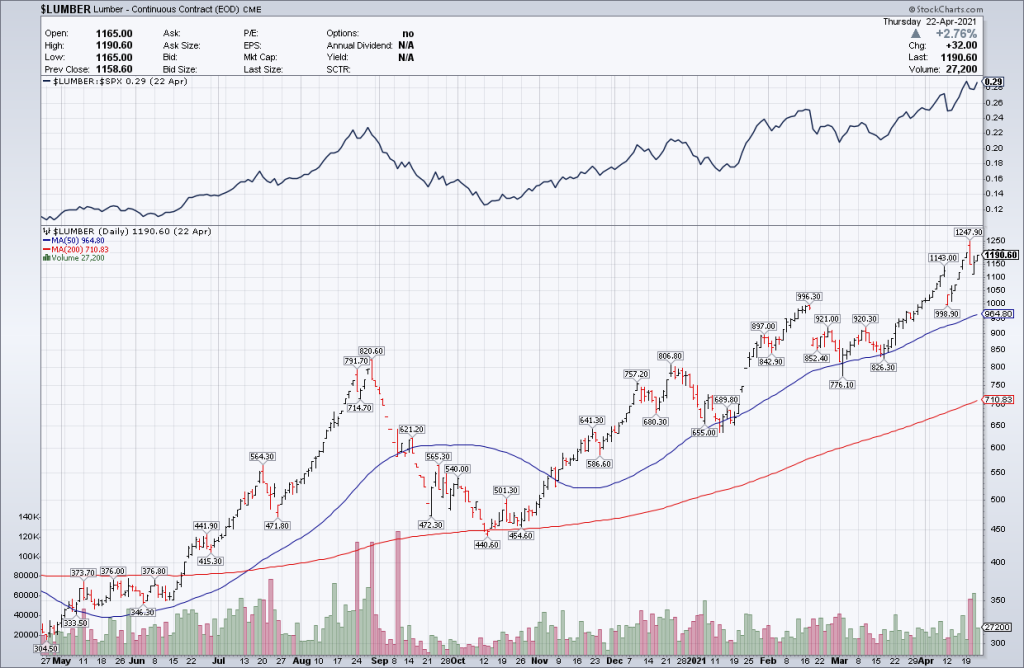
In 2020 to 2024, the biggest tug of war in housing will be between good demographics driving demand and home-price increases suppressing demand when mortgage rates rise. The COVID-19 pandemic has caused the bond market and mortgage rates to be lower than they should be considering current economic conditions. The resulting low mortgage rates have been a blessing for the builders, especially considering the other challenges they face, like skyrocketing lumber prices.

In the current market, low rates are beating lumber prices in that particular paper-rock-scissors game that we are playing. New home sales aren’t working from the low levels we had from 2008 to 2019. New home sales in the years 2020-2024 are an entirely different ball game. Monthly supply levels will be your best guide to where the market is going.

I believe the hostile impact lumber prices will have on-demand in 2021 are overstated, as we can see in the data in the past few months. Lumber prices are a big issue for the entire housing market — not just for the builders but also rehabbers and flippers. Out of all of these, builders are the most capable of handling the high prices.
Homebuilding may be suitable for the public, but it is not a public service. Those who are in the business of rehabilitating homes for sale or rent are in the industry to make money — and won’t take on these projects if the cost of materials eats all the profits.
It will be a great blessing for lumber prices to come down, but we don’t see hints of that happening just yet. When mortgage rates rise, and lumber prices remain high, builders’ confidence will drop, and we can expect a slowdown in new construction. If we do get a big infrastructure plan, labor costs for construction will also increase, eating even more into the builders’ profits. These are things to look out for in the future because we always want to be mindful of the future but not lose focus in the current moment.

The new home sales sector is much different than the existing home sales sector. New homes have all the bells and whistles and are more costly, so the average new home buyer tends to be older and better off financially than the average existing home buyer. This new home sector can’t compete with the existing home sales market in terms of price, so when mortgage rates increase, it’s more of a significant disadvantage to the new home sales market.
However, as we can see, this is not the case today or in the past year. This is one aspect that doesn’t get spoken about too often. We did come from the weakest housing recovery ever, so the production of homes and new home sales weren’t working from an overheated speculative market. The demand for new homes and housing starts from 2018-2021 looks nothing like what we saw from 2002-2005. This is also similar to what we see in the existing home sales market, but we have home price gains as if mortgage demand was as hot as 2002-2005. I did talk about that issue on Bloomberg Financial today and wrote about it yesterday on HousingWire.
We just need to be mindful that we are enjoying some real solid economic data without the consequences of higher mortgage rates and bond yields. At some point in the future, this won’t be the case. Until then, let the monthly supply data guide you as it has guided me for many years.


